Spiega documentation
- Knowledge sharing
- Portfolio
emacs
a practical guide on the different features
sabeiro
2026-06-22 Mon 00:00
Created: 2026-10-14 Wed 13:50
emacs
Emacs is the main software I use since 2002. You never feel you understand it enough and every time I tried something different I really couldn't perceive the advantage and went back to emacs. I even asked claude/cursor what would be the best tool for writing software with interactive sessions, organize your workflow as per org mode, coordinate the agents and act on the system at the same time and the bot responded: keep using emacs. LLMs helped me to improve the way I use it and now it's hard to exit it since all the agents, programs and news are integrated here and the different outputs get piped together.
config
My current configuration is .emacs.el. emacs.el is a thin core (STYLE, environment, PACKAGES, INTERFACE, language-modes, BACKUP,
WELCOME, SPELLING); the per-topic config lives in sibling modules in
~/.emacs.d/ loaded after the bootstrap:
org-mode.el (org-roam/md-roam/org-capture), coding.el (corfu/eglot/minuet,
python, node, platformio), llm.el (ollama-buddy/gptel/ellama),
multimedia.el (lilypond).
content
#+BEGIN: columnview :id global :link t :indent t :for#+BEGIN: columnview :id global :link t :indent t :for|||||<10>|
adaptability
Emacs grows with you. IDEs have many configuration options but they don't give you the freedom to adapt to your workflow and many options are limited. Especially the UI doesn't let you create a really readable interface were you just focus on what information is needed. Some useful examples.
.org and emacs
Emacs is the most versatile text editor, it has an overwhelming option of integration and configuration. It takes time to configure it but the productivity speed is unbeatable. I tried IDEs but I find the UI too confusing to concentrate and they force you to work in a single manner. Emacs is the best option for .org too:
- export
- many emacs packages export the files into blog posts and slides
- babel
- you can link system programs to the execution of code blocks
- roam
- in the background all the information you work on are linked together
- integration
- .org connects with all the tools like agenda, web-search, journal …
- tools
- emacs allows agent to use tools
More on
emacs and LLMs
There are multiple configurations to include LLMs in emacs:
- ellama
- for reasoning and structuring the project and for code examples in any buffer
- gptel
- for the integration with mcp
- gptel base
- base package
- mcp.el
- start the hub
- custom gptel tools
- user defined tools
- gptel-mcp
- integration between the packages
- mcp
- for adding my own tools and external mcp
More on and emacs and LLMs.
edit
lisp
variables and functions don't share the same namespace (they can have the same name) You can evaluate the lisp code by hitting [C-x C-e] at the end of the last parenthesis.
- symbols
- begin with :
- quote
- a way to prevent evaluation (+ 1 2) vs '(+ 1 2)
- hash
- #' to access the function namespace
- quasiquote
- de-quote `(1 2 , (+ 1 2)) with comma ,
- operators
- (and ) (or ) (eq ) (not )
- conditional
- (if when unless) (cond )
- setq
- set a variable (setq markdown-marginalize-headers t)
- setopt
- type checking (setopt markdown-marginalize-headers "ciccia")
- loop
- (cl-loop for i from 0 to 10 collect (* i i)) (while …)
- dotimes
- (setq total nil)(dotimes (i 3)(setq total (cons total i)))
- dolist
- (setq total 0)(dolist (i '(1 2 3))(setq total (+ total i)))
- mapcar
- apply a function to each element of a list (mapcar #'1+ '(1 2 3))
- hook
- list of functions in a particular situation (add-hook ) (run-hook )
(defun sing-fun () ;;(interactive) (insert "ciccia")
       (run-hooks 'fun-hook))
(add-hook 'fun-hook (lambda () (insert "3")))
variables
I can set variables with (setq ciccia "ciccia") or groups (customize-group org-export-hugo)
- string
- "ciccia"
- symbol
- 'ciccia'
- keyword
- :ciccia
- temp
- with let (defun cucco () (let ((cic (+ 2 3))(cioc (+ 4 5)))(- cic cioc))) (cucco)
- chars
- ?h (output hex)
- bool
- true -> t, false -> nil
- plist
- '(key "value" key2 value) or '(:key value :key2 value)
lists
- pairs
- (cons 1 2) -> (1 . 2)
- list
- (list 1 3 4 5) -> (1 3 4 5)
- car
- first value of a list (car '(1 3 4 5))
- cdr
- the rest of a list (cdr '(3 94 85 8))
- symbol_plist
- with symbolic links (check if a function is interactive only, class type…) (symbol_plist #'magit-dispatch)
- linked lists
- (cons 1 (cons 2 nil))
functions
define (defun insert-numbers () "insert a sequence of numbers" (interactive) (insert "\n 1 2 3")) and execute function (insert-numbers)
- defun
- (defun test-fun (arg) (+ arg 2)) (defun foo () 5)
- output
- (message "1 2 3") -> minibuffer (insert "1 2 3") -> buffer
- interactive
- makes the function listed in [M-x]
- advice
- a decorator
- cl_defun
- (cl-defun fun-with-kwargs (&key foo bar) (format "%s %s" foo bar))
- setf
- progn
- execute functions in sequence
(insert "\nciccia " "ciccio") ciccia ciccio
(eq :foo ':foo)
(defun test-fun (arg) (+ arg 2))
(defun make-odd (arg) (if (% arg 2) (+ arg 1) arg))
(advice-add 'test-fun :filter-return #'make-odd)
(test-fun 4)
(defun insert-code-block ()
  (insert "\n#+begin_src :exports both :results output replace \n\n#+end_src"))
(keymap-set c-mode-map "C-M-b" 'insert-code-block)
import re
None
keybinding
find keymap associated to lisp command: [C-h w] (command-name)
(describe-key (kbd "M-:"))
(global-set-key (kbd "C-Alt-d") 'delete-region)
(keymap-global-set "C-Alt-d" 'delete-region) ;; newer version
Check all key mapping in org-mode
(describe-keymap 'org-mode-map)
(describe-keymap magit-mode-map)
KEYMAP\ OBJECT\ \(no\ variable\)\ 42
docs
Edit variable definition [C-h v]
(describe-function 'package-install)
search
- isearch
- elisp:(isearch)
configuration
font and faces
(custom-set-variables
 '(ansi-color-faces-vector
   [default default default italic underline success warning error])
 '(ansi-color-names-vector
   ["#000044" "#d55e00" "#009e73" "#f8ec59" "#0072b2" "#cc79a7" "#56b4e9" "white"])
 '(custom-enabled-themes '(misterioso))
 '(custom-safe-themes
   '("43b0db785fc313b52a42f8e5e88d12e6bd6ff9cee5ffb3591acf51bbd465b3f4" "47aaf1021bdd742a2f91448f089ad6fe95028c9557638d4333452ce85da980de" default)))
You can change the theme by hitting [C-x C-e] after the last parenthesis
(load-theme 'misterioso) (load-theme 'tango-dark) (load-theme 'wheatgrass) (load-theme 'whiteboard) (load-theme 'light-blue) (load-theme 'deeper-blue) (load-theme 'modus-vivendi) (load-theme 'leuven-dark)
(org-modern-mode 1)
(set-frame-parameter (selected-frame) 'alpha 100) (set-frame-parameter (selected-frame) 'alpha 80)
full screen [f11]
icons
We can use icons as we write (all-the-icons-wicon "tornado" :face 'all-the-icons-blue)
(use-package all-the-icons
  :if (display-graphic-p))
(all-the-icons-install-fonts)
(all-the-icons-insert-material "account-balance")
(use-package all-the-icons-dired
  :hook (dired-mode . all-the-icons-dired-mode))
Prettify symbols
(setq prettify-symbol-alist
(mapcan (lambda (x) (list x (cons (upcase (car x)) (cdr x))))
'(("bug" . ?)
("lambda" . ?λ)
("software" . ?)
))
)
(defconst lisp--prettify-symbols-alist
'(("lambda" . ?λ)))
(add-hook 'emacs-lisp-mode-hook
(lambda ()
(push '(">=" . ?≥) prettify-symbols-alist)))
(prettify-symbols-mode 1)
A bug is a when a software fails.
packages
To use the packages listed here open this org file in emacs and set straight.el to test the experimental packages
;; If you're using straight.el, keep package.el from auto-loading.
(add-to-list 'load-path (expand-file-name "~/.emacs.d/lisp/"))
(setq package-enable-at-startup nil)
;; Bootstrap straight.el
(defvar bootstrap-version)
(let ((bootstrap-file
       (expand-file-name "straight/repos/straight.el/bootstrap.el"
                         user-emacs-directory))
      (bootstrap-version 7))
  (unless (file-exists-p bootstrap-file)
    (with-current-buffer
        (url-retrieve-synchronously
         "https://raw.githubusercontent.com/radian-software/straight.el/develop/install.el"
         'silent 'inhibit-cookies)
      (goto-char (point-max))
      (eval-print-last-sexp)))
  (load bootstrap-file nil 'nomessage))
(straight-use-package 'use-package)
(setq straight-use-package-by-default t)
(use-package package)
(setq package-archives
      '(("melpa" . "https://melpa.org/packages/")
        ("melpa-stable" . "https://stable.melpa.org/packages/")
        ("gnu" . "https://elpa.gnu.org/packages/")
        ("nongnu" . "https://elpa.nongnu.org/nongnu/")))
(setq package-archive-priorities
      '(("melpa-stable" . 10)
        ("gnu" . 7)
        ("melpa" . 5)))
(setq package-check-signature 'allow-unsigned)
(setq package-archive-contents nil)
(package-initialize)
(advice-add 'package-refresh-contents :override
            (lambda (&rest _)
              (message "Package refresh skipped (run M-x list-packages to refresh archives)"))
            '((name . no-refresh-on-init)))
(setq byte-compile-warnings '(cl-functions))
(use-package cl-lib)
(let ((default-directory  "~/.emacs.d/"))
  (normal-top-level-add-subdirs-to-load-path))
(add-to-list 'load-path "~/.emacs.d/lisp/")
software
There is a rich collections of software which can be added to emacs.
anki cards
We can use flashcards for learning
(use-package anki-editor
  :defer t
  :straight (:host github :type git :repo "anki-editor/anki-editor"))
We can then use anki properties
#+begin_example
card
Front
(it's) raining cats and dogs
Back
it's raining very hard
basic
sect1
extract from field value
Front
Notice that property fields will override subheading fields. This block will be skipped
#+end_example
canvas
(setq W 250
      H 250
      BG #xFF8B00FF)
(setq ball-canvas-vec (make-vector (* W H) BG))
(setq ball-canvas `(image :type canvas :id rect :data-width ,W :data-height ,H :data ,ball-canvas-vec))
(insert (propertize "#" 'display ball-canvas))
(defun draw-ball (cx cy color)
  (let ((r2 (* ball-radius ball-radius))) ; Radius squared
    (dotimes (y-off (1+ (* 2 ball-radius)))
      (dotimes (x-off (1+ (* 2 ball-radius)))
        (let* ((px (+ cx (- x-off ball-radius)))
               (py (+ cy (- y-off ball-radius)))
               (dx-local (- px cx)) ; Horizontal distance from center
               (dy-local (- py cy)) ; Vertical distance from center
               (dist2 (+ (* dx-local dx-local) (* dy-local dy-local)))) ; squared distance using pythagorean theorem
          ;; check if pixel is inside the circle AND inside the canvas bounds
          (when (and (>= px 0) (< px W) (>= py 0) (< py H) (<= dist2 r2))
            (aset ball-canvas-vec (+ (* py W) px) color)))))))
(defun ball-bounce ()
  (setq bx (+ bx dx) by (+ by dy))
  ;; compare with ball-radius so the *edge* of the circle bounces, not the center.
  (when (<= bx ball-radius) (setq dx (abs dx)) (setq bx ball-radius))
  (when (>= bx (- W ball-radius)) (setq dx (- (abs dx))) (setq bx (- W ball-radius)))
  (when (<= by ball-radius) (setq dy (abs dy)) (setq by ball-radius))
  (when (>= by (- H ball-radius)) (setq dy (- (abs dy))) (setq by (- H ball-radius))))
(setq ball-frame 0)
(setq max-ball-frames 2000)
(defun ball-loop ()
  (if (>= ball-frame max-ball-frames)
      (cancel-timer ball-timer)
    (setq ball-frame (1+ ball-frame))
    (draw-ball bx by BG) ; make old ball invisible (turn it into background color)
    (ball-bounce)
    (draw-ball bx by ball-color)
    (canvas-refresh ball-canvas t)))
(setq ball-timer (run-with-timer 0 0.02 'ball-loop))
shader
(defvar ob-shader-start (float-time))
(defvar ob-shader-canvas '(image :type canvas :id ob-shader :data-width 300 :data-height 300))
(defvar ob-shader-timer (run-with-timer
                         nil (/ 1 60.0)
                         (lambda ()
                           (ob-shader-render ob-shader-canvas (- (float-time) ob-shader-start))
                           (canvas-refresh ob-shader-canvas))))
(setq backup-inhibited t
      create-lockfiles nil
      auto-save-default nil
      auto-save-no-message t
      auto-save-list-file-prefix nil
      org-confirm-babel-evaluate nil)

(defun org-babel-execute:shader (body _params)
  (ob-shader-load (format "
precision mediump float;
varying vec2 vUV;
uniform float t;
void main() {
  vec2 p = vUV * 2.0 - 1.0;
  float x = p.x, y = p.y, a = atan(y, x), r = length(p);
  float R, G, B;
  %s
  gl_FragColor = vec4(B, G, R, 1.0);
}
" body)))

(font-lock-add-keywords 'org-mode `((": {SHADER}" 0 '(face nil display ,ob-shader-canvas))) t)
(shell-command (format "gcc -O2 -I%ssrc ob-shader.c -o /tmp/ob-shader.so -lGL -lEGL -fPIC -shared"
                       (shell-quote-argument source-directory)))
(module-load "/tmp/ob-shader.so")

(add-hook 'org-mode-hook
          (lambda ()
            (when (string-search "ob-shader.org" (buffer-file-name))
              (with-silent-modifications
                (org-babel-execute-buffer)))))
R = (cos(210.0*x*y + 5.0*t) + 1.0) / 2.0;
G = (cos(200.0*x*y + 5.0*t) + 1.0) / 2.0;
B = (cos(10.0*x*y + 5.0*t) + 1.0) / 2.0;
{SHADER}
float z = sin(a * 10.0 + r * 15.0 - t * 5.0);
R = G = 0.5 + 0.5 * sin(z + t * 0.1);
B = 0.5 + 0.4 * sin(10.0*z + t * 0.2);
{SHADER}
pdf-tools
;; sudo apt-get install -y autoconf automake gcc libpng-dev libpoppler-dev libpoppler-glib-dev libz-dev make pkg-config
(use-package pdf-tools
  :defer t
  :commands (pdf-loader-install)
  :mode "\\.pdf\\'"
  :bind (:map pdf-view-mode-map
              ("j" . pdf-view-next-line-or-next-page)
              ("k" . pdf-view-previous-line-or-previous-page)
              ("C-=" . pdf-view-enlarge)
              ("C--" . pdf-view-shrink))
  :init (pdf-loader-install)
  :config (add-to-list 'revert-without-query ".pdf"))
(add-hook 'pdf-view-mode-hook #'(lambda () (interactive) (display-line-number-mode -1 )))
perspective
Multiple named workspaces
(use-package perspective)
reader
Document reader for emacs
(use-package reader
  :straight '(reader :type git :host codeberg :repo "MonadicSheep/emacs-reader"))
dashboard
Set a splash screen (dashboard-open)
(use-package dashboard
  :ensure t
  :config
  (dashboard-setup-startup-hook))
;; (setq initial-buffer-choice 'dashboard-open)
(setq dashboard-banner-logo-title "intertino dell'anticolo")
(setq dashboard-startup-banner "logo-ansi-truecolor")
(setq dashboard-center-content t)
(setq dashboard-vertically-center-content t)
(setq dashboard-show-shortcuts nil)
(setq dashboard-items '((recents   . 5) (bookmarks . 5) (projects  . 5) (agenda    . 5) (registers . 5)))
(setq dashboard-item-shortcuts '((recents   . "r") (bookmarks . "m") (projects  . "p") (agenda    . "a")         (registers . "e")))
(setq dashboard-startupify-list '(dashboard-insert-banner dashboard-insert-newline dashboard-insert-banner-title
                                  dashboard-insert-newline dashboard-insert-navigator dashboard-insert-newline
                                  dashboard-insert-init-info dashboard-insert-items dashboard-insert-newline
                                  dashboard-insert-footer))
(setq dashboard-navigation-cycle t)
(setq dashboard-display-icons-p t)
(setq dashboard-icon-type 'all-the-icons)
(add-to-list 'dashboard-items '(agenda) t)
(setq dashboard-week-agenda t)
econky
(add-to-list 'load-path "~/.emacs.d/lisp/econky")
(require 'econky)
(defun my/setup-econky-frame (frame)
  "Configura o layout 80/20 ao abrir um novo frame via emacsclient."
  (with-selected-frame frame
    (let ((econky-buffer (get-buffer-create "*econky*")))
      (econky-start)
      (let ((window-side (split-window-right (- (window-total-width)
                                                (/ (window-total-width) 5)))))
        (switch-to-buffer "*scratch*")
        (set-window-buffer window-side econky-buffer)
        (set-window-dedicated-p window-side t)))))
(add-hook 'after-make-frame-functions #'my/setup-econky-frame)
websearch
We can call ddgs for web search
# search results
pip install -U ddgs
ddgs text -k "ffmpeg interpolate between frames"
browsing
deft is a package for browsing plain test notes. It is useful to rename variables
(use-package deft ;;for quickly browsing, filtering, and editing directories of plain text notes
    :after org
    :bind
    ("C-c n d" . deft)
    :custom
    (deft-recursive t)
    (deft-use-filter-string-for-filename t)
    (deft-default-extension "org")
    (deft-directory org-roam-directory))
note taking
denote is a note taking package easing the naming of files and linked sources doc.
(use-package denote ;;namespace and metadata for files
  :ensure t
  :hook (dired-mode . denote-dired-mode)
  :bind
  (("C-c n n" . denote)
   ("C-c n r" . denote-rename-file)
   ("C-c n l" . denote-link)
   ("C-c n b" . denote-backlinks)
   ("C-c n d" . denote-dired)
   ("C-c n g" . denote-grep))
  :config
  (setq denote-directory (expand-file-name "~/lav/src/spiega/project/"))
  (denote-rename-buffer-mode 1))
spelling
We install some spell checkers and the integration with them
sudo apt install aspell-fr aspell-de aspell-it hunspell hunspell-it
(cond
  ((executable-find "hunspell")
   (setq ispell-program-name "hunspell")
   (ispell-set-spellchecker-params)
   (setq ispell-local-dictionary "en_US,it_IT")
   (ispell-hunspell-add-multi-dic "en_GB,it_IT")
   (setq ispell-local-dictionary-alist
         '(("en_US" "[[:alpha:]]" "[^[:alpha:]]" "[']" nil ("-d" "en_US") nil utf-8))))
  ((executable-find "aspell")
   (setq ispell-program-name "aspell")
   (setq ispell-extra-args '("--sug-mode=ultra" "--lang=en_US"))))
(add-hook 'text-mode-hook 'flyspell-mode)
;; For markdown, use flyspell but skip code blocks and URLs
(add-hook 'markdown-mode-hook
          (lambda ()
            (setq flyspell-generic-check-word-predicate
                  (lambda ()
                    (not (or (markdown-code-block-at-point-p)
                             (markdown-inline-code-at-point-p)
                             (markdown-link-p)))))
            (flyspell-mode 1)))
commands
[M-x] opens minibuffer [M-|] shell command on region [M-:] eval eval-region
register and bookmarks
Registers and bookmarks in emacs are temporary information you can save in your session.
The useful commands for registers and bookmarks are:
- [M-x]
- insert bookmark
- [C-x r SPC]
- to save register in buffer (give it a name)
- [C-x r s]
- store text into a register
- [C-x r +]
- append to register
- [C-x r i]
- insert text from register
- [C-u C-x r i]
- insert and replace
- [C-x r c]
- copy to clipboard
- [C-x y j]
- jump to register
- [C-x b]
- to save the current bookmark
- [C-x r b]
- To add bookmark, mark position
- [C-x]
- to save bookmark
- [C-x f]
- To list all bookmark
A bookmark is persistent
- [C-x r m]
- create a bookmark
- (no term)
- elisp:(bookmark-save)
(set-register ?h '(file . "~/lav/src/spiega/template/header_org.org"))
(file . ~/lav/src/spiega/template/header_org.org)
keybindings
#+name : keybindings
(describe-key "C-a")
C - a is undefined
edit
- region
- [SPC ->] [SPC <-] select region [M-w] copy region [C-y] paste region [M-y] cycle copied regions [M-@] add a word to region [M-h] select paragraph/function [C-x h] [C-x C-p] mark buffer/page [C-x C-x] mark till previous location
- navigate
- [C-u C-SPC] cursor back to previous location
dired file manager
How to use dired
- open
- [C-x C-j] to open dired [C-x C-q] W-dired mode [C-c C-c] finished [o] opens in a new buffer [C-o] temporarly opens in a new buffer
- navigate
- [i] opens a subdirectory in the same buffer [^] level up [C-u C-SPC] move the cursor back [C-M-n] next subdirectory [C-M-p] previous subdirectory [C-M-u] up a level [C-M-d] down a level [<] [>] move between directories [$] toggle directory [M-g] header line [A] search within marked files
- deletion
- [d] mark for deletion [x] delete flagged files [D] delete marked files [u] unmark for deletion [% d] deletion with regexp
- select
- [* /] select directories [* s] select files [* c] [u] unmark [* %] regexp [M {] [M }] navigate marked [e] open marked file
- copy/move
- [+] new directory [c] copy marked files into new directory [H] [S] [Y] links (hard, symbolic, relative) [M] [G] [O] chmod/chgrp/chown
- edit
- [Q] sed in the marked files [&] asychrounous job [?] iterate once per each file [*] expand the file name [% R] rename files with regexp (old_\(.*\) -> new_\&) [% l] [% u] uppercase lowercase
- search
- elisp:(find-grep-dired) search file content
media player
(use-package emms)
shell
Shell in a buffer
- shell
- [C-e s] elisp:(eshell)
Insert a shell command elisp:(org-insert-structure-template%20%22s%22) [C-c C-x s s]
(("n" . "notes") ("a" . "export ascii") ("c" . "center")("C" . "comment") ("e" . "example") ("E" . "export")("h" . "export html") ("l" . "export latex") ("q" . "quote")("s" . "src") ("v" . "verse"))
web browser
You can start a web browser elisp:(eww%20'%22intertino.it%22)
media player
We can use a media player by launching elisp:(emms)
(use-package emms
  :config (setq emms-add-directory-tree "~/Music/")
  )
news feed
Retrieve the news feed elisp:(elfeed)
(use-package elfeed)
(setq elfeed-feeds
      '(("https://nullprogram.com/feed/" blog )
        ("https://planet.emacslife.com/atom.xml" )
        ("https://www.rainews.it/rss" rai)
        ("https://yhetil.org/emacs-devel/new.atom" emacs lists devel)
        ("https://yhetil.org/emacs-bugs/new.atom" emacs lists bugs)
        ("https://sachachua.com/blog/category/emacs-news/feed/" emacs news)))
(setf url-queue-timeout 30)
30
We can use mu4e package.
(use-package mu4e)
voice assistant
Voice assistant and dictation
;; https://git.sr.ht/~lepisma/emacs-speech-input
(use-package esi-dictate
  :straight (:host github :type git :repo "lepisma/emacs-speech-input")
  :custom
  (esi-dictate-dg-api-key "<DEEPGRAM-API-KEY>")
  (esi-dictate-llm-provider <llm-provider-using-llm.el>)
  ; (esi-dictate-llm-prompt )
  ; Here is an example configuration for using OpenAI's
  ; (esi-dictate-llm-provider (make-llm-openai :key "<OPENAI-API-KEY>" :chat-model "gpt-4o-mini"))
  :bind (:map esi-dictate-mode-map
              ("C-g" . esi-dictate-stop))
  :config
  (setq llm-warn-on-nonfree nil)
  :hook (esi-dictate-speech-final . esi-dictate-fix-context))
Could not install
(use-package voicemacs
  :straight (:host github :type git :repo "jcaw/voicemacs" )
  )
t
multimedia
Collection of tools for multimedia files
edraw
We launch
edraw:file=../../f/f_twin/edraw_res.svg
by hitting [C-c C-o] on the link and finish with [C-c C-c]
or (edraw)
[[*Example][edraw:file=../../f/f_twin/edraw_res.svg]]
<edraw:file=../../f/f_twin/edraw_res.svg>
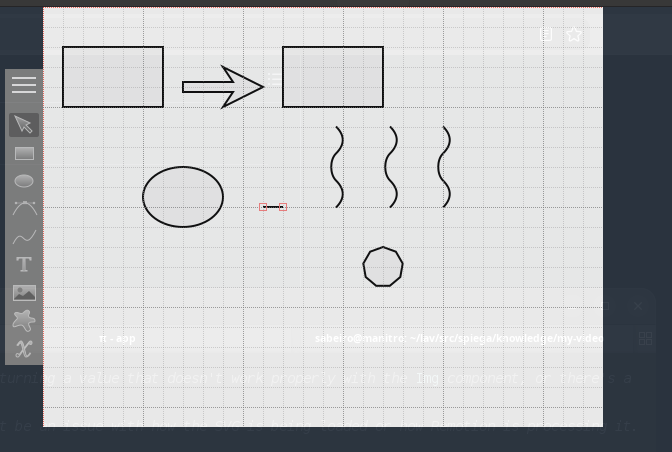
(use-package edraw-org
    :straight (:host github :type git :repo "misohena/el-easydraw")
    :config (edraw-org-setup-default)
    (edraw-org-setup-exporter))
inkscape
(when (use-package 'dbus nil t)
  (defun inkscape-test ()
    "Test Inkscape D-Bus integration - creates a new desktop with a rectangle."
    (interactive)
    (let* ((desktop (dbus-call-method
                     :session "org.inkscape" "/org/inkscape/application"
                     "org.inkscape.application" "desktop_new"))
           (rect (dbus-call-method
                  :session "org.inkscape" desktop
                  "org.inkscape.document" "rectangle"
                  :int32 100 :int32 100 :int32 100 :int32 100)))
      (message "Created desktop: %s, rectangle: %s" desktop rect))))
lilypond
Dependencies
sudo apt install lilypond timidity gv xpdf
Some useful commands (LilyPond-electric-bar) counts within bars
LilyPond-autocompletion (S-<iso-lefttab>)
LilyPond-command-all-midi (C-c C-<return>)   Play midi corresponding to the current
LilyPond-command-buffer (C-c C-b)   Run LilyPond on buffer.
LilyPond-command-current-midi (C-c <return>)   Play midi corresponding to the current document.
LilyPond-command-formatmidi (C-c m)   Format the midi output of the current document.
LilyPond-command-lilypond (C-c C-l)   Run lilypond for the current document.
LilyPond-command-master (C-c C-c)   Run command on the current document.
LilyPond-command-view (C-c C-s)   View the output of current document.
LilyPond-music-glossary-info   Launch Info for music-glossary.
LilyPond-quick-insert-mode (C-c q)   Insert notes with fewer key strokes by using a simple keyboard piano.
LilyPond-what-beat (C-c b)   Returns how much of a measure lies between last measaure ’|’ and point.
(require 'lilypond-mode)
(autoload 'LilyPond-mode "lilypond-mode" "LilyPond Editing Mode" t)
(add-to-list 'auto-mode-alist '("\\.ly$" . LilyPond-mode))
(add-to-list 'auto-mode-alist '("\\.ily$" . LilyPond-mode))
(add-hook 'LilyPond-mode-hook (lambda () (turn-on-font-lock)))
(add-hook 'LilyPond-mode-hook (function (lambda () (add-to-list 'LilyPond-command-alist '("OpenPDF" "open '%f'")))))
(defvar ac-lilypond-identifiers
  '((candidates . (lambda () (all-completions ac-target LilyPond-identifiers)))))
(defvar ni-LilyPond-keywords
  (mapcar (lambda (x) (concat "\\" x)) LilyPond-keywords))
(defvar ac-lilypond-keywords
  '((candidates . (lambda () (all-completions ac-target ni-LilyPond-keywords)))))
(defvar ac-lilypond-Creserved-words
  '((candidates . (lambda () (all-completions ac-target LilyPond-Capitalized-Reserved-Words)))))
(defvar ac-lilypond-ncreserved-words
  '((candidates . (lambda () (all-completions ac-target LilyPond-non-capitalized-reserved-words)))))
(provide 'init-lilypond)
midi device
We can connect a midi device to interact with lilypond
cd ~/lav/viudi/synth/rasp/soundfont
bash ./fluidsynth.sh
aconnect -o
aconnect 28 128
client 14: 'Midi Through' [type=kernel]
    0 'Midi Through Port-0'
client 28: 'nanoKEY Fold' [type=kernel,card=3]
    0 'nanoKEY Fold _ CTRL'
client 128: 'fluid0' [type=user,pid=173475]
    0 'fluid0          '
video subtitles
(use-package org-media-note
  :straight (:host github :type git :repo "yuchen-lea/org-media-note")
  :init (setq  org-media-note-use-cite t)
  :hook (org-mode .  org-media-note-mode)
  :bind (
         ("H-v" . org-media-note-show-interface))  ;; Main entrance
  :config
  (setq org-media-note-screenshot-image-dir "~/Downloads/imgs/")  ;; Folder to save screenshot
  )
(org-media-note-show-interface)
media player
(use-package mpv
  :straight (:host github :type git :repo "kljohann/mpv.el")
  )
(mpv-play "~/VideoProd/publicati/albio.mp4")
midi player
(start-process "midi-player" nil "timidity" "-Ow" "~/lav/viudi/mus/bolla/Corsa.midi")
;;(use-package midi-emacs)
(defun play-midi-fluidsynth (file soundfont)
  "Play MIDI file with fluidsynth and soundfont."
  (start-process "fluidsynth" nil "fluidsynth" soundfont file))
(defun play-midi-file (file)
  "Play MIDI file using timidity."
  (start-process "timidity" nil "timidity" file))
(play-midi-fluidsynth "~/lav/viudi/mus/bolla/Corsa.midi" "~/lav/Audio/sf2/Sonatina.sf2") (play-midi-file "~/lav/viudi/mus/bolla/Corsa.midi")
gnome
We can configure gnome to support using emacs.
gsettings list-recursively org.gnome.desktop.input-sources
gsettings set org.gnome.desktop.input-sources xkb-options "['hyper:menu']"
gsettings set org.gnome.desktop.input-sources xkb-options "['caps:hyper', 'insert:hyper']"
#xkeyboard-config
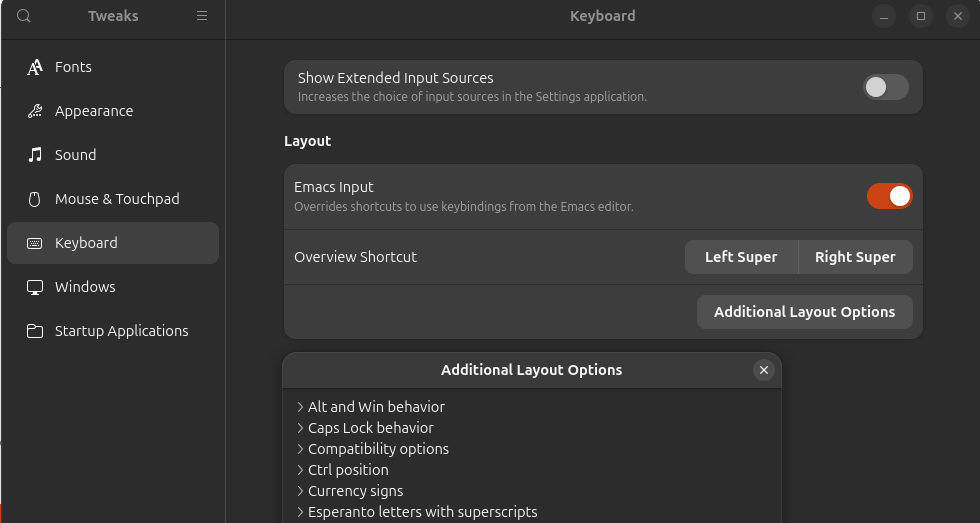
#sudo apt-get install gnome-tweak-tool
gnome-tweak-tools
coding
How can we configure emacs for coding.
web-mode
We can use web-mode for css, js, json, php, html, node:
(use-package web-mode
  :ensure t
  :mode
  (("\\.html\\'" . web-mode)
   ("\\.php\\'" . web-mode)
   ("\\.ts\\'" . web-mode)
   ("\\.tsx\\'" . web-mode)
   ("\\.css\\'" . web-mode)
   ("\\.js\\'" . web-mode)))
(setq web-mode-engines-alist
      '(("php"    . "\\.phtml\\'")
        ("blade"  . "\\.blade\\."))
)
pnpm install typescript-language-server typescript
language server
We can connect emacs to a language server (LSP) which runs externally checks on the code
(use-package lsp-mode
  :commands (lsp lsp-deferred)
  :hook ((prog-mode . lsp-deferred)
         (python-mode . lsp)
         (lsp-mode . lsp-enable-which-key-integration))
  :custom (read-process-output-max (* 1024 1024))
  :init
  (setq lsp-completion-provider :none)
  (setq lsp-keymap-prefix "C-c l")
  (setq lsp-diagostic-provider :flycheck)
  )
(use-package lsp-ui
  :hook (lsp-mode . flycheck-mode)
  ;; :bind (:map flycheck-mode-map
  ;;          ("M-n" flycheck-previous-error)
  ;;          ("M-p" flycheck-next-error))
  :custom (flycheck-display-error-delay .3))
| flycheck-mode | lsp-enable-which-key-integration |
linters
- flycheck
- flymake
- blacken
project
projectile
Projectile helps with managing files in your projects, build, run, search, substitute…
We can:
- dashboard
- (projectile-dashboard)
- search
- (projectile-search-review)
- todo
- (projectile-todos)
- bookmark
- (projectile-bookmark-jump)
- dispatch
(projectile-dispatch) (setq projectile-indexing-method 'hybrid) (setq projectile-enable-caching t)
(projectile-index-project-async) -> [Projectile] Async indexing has no effect while caching is disabled (define-key projectile-mode-map (kbd "s-,") 'projectile-command-map)
code assistant
The live emacs.el builds coding assistance from three layers that do not collide because each owns a different moment of the interaction (see the autocompletion guide below):
- eglot
- language-server protocol (pyright for Python, typescript-language-server for TS/JS). Feeds real code completions.
- corfu
- popup UI that shows candidates from any completion-at-point source.
- minuet
- AI ghost-text suggestions ("inline copilot"), generated by a local LLM.
The legacy Python completer stack (company, company-jedi, elpy, flymake+pylint) has been removed from emacs.el; only eglot + corfu + minuet remain active. Flycheck is still used for graphviz (dot) files.
Few references: gavinok
eglot
- [M .]
- find definition [M ,] return
- [M ?]
- find references [M ,] return
- [M /]
- go to next diagnostics [M ,] return
- [C M i]
- complete
- (no term)
- [M ;]
- toggle comment
company-mode
- [C M o]
- [C M f]
- find file
corfu
- [C M x]
- show candidates
The AI/ghost-text backend is swappable
minuet talks to whatever LLM serving backend is up. Because the backend
can change over time (unsloth, LM Studio, llama.cpp, vLLM, ollama…), the
relevant knobs in emacs.el are the three minuet-openai-fim-compatible-options
plists and the model name:
:end-point- the URL of the OpenAI-compatible completions endpoint.
:api-key- a token, an env-var name such as
"UNSLOTH_TOKEN"(minuet resolves the env var at request time), or a placeholder like"TERM"for backends that ignore auth. :model- the model identifier; coder/FIM-aware models give the best ghost-text quality.
| Backend | Typical endpoint | Auth | Notes |
|---|---|---|---|
| unsloth | http://localhost:8889/api/inference/completions |
Bearer UNSLOTH_TOKEN |
GGUF served via llama.cpp proxy; chat models give weak FIM output |
| LM Studio | http://localhost:1234/v1/completions |
none (placeholder) | OpenAI-compatible server UI |
| llama.cpp | http://localhost:8080/v1/completions |
none (placeholder) | llama-server / llama-cli --server |
| vLLM | http://localhost:8000/v1/completions |
depends on config | needs a server image with FIM support |
| ollama | http://localhost:11434/v1/completions |
none (placeholder) | OpenAI-compat layer; models like qwen2.5-coder |
| lemonade | http://localhost:13305/v1/completions |
none (placeholder) | OpenAI-compat layer; models like qwen2.5-coder |
Any switch is a one-line :end-point change (plus re-pulling/reloading the
model on the serving side) — the rest of minuet's config stays identical.
This is the same "bring your own backend" idea that ellama and ollama-buddy
use (local LLM clients).
- Hardware-aware recommendation (recommend, never auto-switch)
This config is meant to run on laptops of very different power (a gaming laptop with a GPU, an old thin client, …). emacs.el detects the machine and reports the recommended stack, but never applies it automatically — the same emacs.el runs everywhere.
packages-recommended-for-hardware- returns the recommendation plist
(:tier full|lite :packages (...) :auto-suggest t|nil :eglot-auto t|nil
  :reason string)
. packages-report-hardware- prints CPU/RAM/recommendation at startup
(
M-xto re-show). packages-apply-recommended- manual
M-xto apply the recommended tier.
Heuristic: >= 8 CPUs and >= 16 GB RAM =>
full, elselite. Override per machine withmachine/ai-stack(below) or the env varEMACS_AI_STACK=full|lite.tier auto-suggest eglot packages when full yes auto eglot corfu minuet gaming/workstation or any box with a local LLM running lite no (manual) manual corfu dabbrev old/thin laptop, visible UI lag, or no LLM available - Per-machine overlay: .emacs.d/machine.el
emacs.el stays identical on every laptop. A git-ignored
~/.emacs.d/machine.el(sibling ofellama_setup.el/gptel_tools.el, in the repo underemacs/.emacs.d/) is loaded if present and overrides the fallbacks. Copy the shipped template and set only what differs on this host:machine/ai-stack"full"or"lite"(nil = auto from hardware).- (no term)
machine/minuet-host/machine/minuet-port/machine/minuet-model/machine/minuet-api-key/machine/minuet-endpoint:: the minuet LLM backend — host, port, model, auth, and the actual OpenAI-compatible FIM route (different servers expose it at different paths).machine/ollama-url/machine/unsloth-url- feed
ellama_setup.elmodel discovery.
Because the end-point host/port/model now come from machine.el, switching backends on a given machine is a one-line edit in that file.
- minuet resilience (missing local LLM)
minuet never blocks Emacs or spams errors when the LLM is absent:
- At startup
my/minuet-probe-backendTCP-probes the minuet endpoint (1s timeout, asynchronous). Only if the server answers and the tier isfulldoes auto-suggest turn on. - With no backend, auto-suggest stays off (
M-istays quick and harmless); a dead backend just yields a one-line message instead of a freeze. - Plain-English: minuet also suggests in prose buffers — it is hooked into
org-mode-hookandtext-mode-hook(same gate: backend up and tierfull), so ghost-text works when writing notes/markdown too, and stays off on thelitetier. - When the UI lags, apply the lighter stack at any time with
M-x packages-apply-recommended.
- At startup
Startup behavior (fast boot, splash, session restore)
To keep a cold boot snappy the heavy / asynchronous work is deferred:
org-roam- is fully lazy: it registers its hooks at load but never builds
the DB at boot (a large vault of hundreds of org+md files would otherwise make
startup appear to hang).
org-roam-db-autosync-modeandmd-roam-modeare enabled on the first actual roam command (orM-x org-roam-db-sync), so the DB is (re)built on demand instead of blocking cold boot. minuet- probes its backend in the background (see above).
ellama- refreshes its provider list on a 3-second idle timer.
straight- the transient
*straight-process*buffer is killed once straight.el finishes (my/kill-straight-process-bufferon a 1-second start timer), so it no longer lingers in the buffer list.
Instead of the default disabled splash screen you get a small custom
welcome buffer (*welcome*, M-x my/welcome-buffer) with the date, quick
commands, and clickable recent files (recentf, now enabled).
The previous session's buffers return lazily via desktop mode:
desktop-restore-eager is 0 so heavy modes load without blocking — the welcome
splash stays as the landing screen while buffers restore in the background.
auto-completion
Built-in:
- dabbrev
- expand: [M-/] complete: [M-C-/]
- hippie-expand
- cape
- completion at point
Extensions (active):
- minuet
- elisp:(minuet-next-suggestion) AI ghost-text (local LLM)
- corfu
- elisp:(corfu-mode) popup UI for completion-at-point
- eglot
- language-server completions (pyright, typescript-language-server)
- helm
- ivy
- devdocs
(company and company-jedi were the older Python completer; removed from emacs.el.)
Minibuffer completion
- vertico
- elisp:(use-package%20vertico) drop down menu
- orderless
- elisp:(use-package%20orderless)
- consult
- marginalia
- embark
(use-package vertico ;;minibuffer completion
  :ensure t
  :init (vertico-mode)
  :bind (:map minibuffer-local-map
              ("<next>" . vertico-next-group)
              ("<prior>" . vertico-previous-group)))
vertico-previous-group
autocompletion guide (current setup)
This is the autocompletion stack configured in the live emacs.el. It layers three tools that do not collide because each activates in a different context:
- corfu
- popup UI that shows candidates from any completion-at-point source
- eglot
- language-server protocol; feeds corfu real code completions
- minuet
- AI ghost-text suggestions from the local LLM
The key rule that keeps them from colliding: TAB means one thing at a time. When a minuet ghost is on screen, minuet-active-mode-map owns TAB (accept the AI suggestion); otherwise TAB goes to corfu; with no candidate at all, TAB just indents (tab-always-indent set to 'complete).
bindings
| key | context | action |
|---|---|---|
| TAB | corfu popup visible | corfu-insert (accept completion) |
| TAB | minuet ghost visible | minuet-accept-suggestion-line (accept first AI line) |
| M-a | minuet ghost visible | accept AI suggestion line |
| M-A | minuet ghost visible | accept whole AI suggestion |
| M-e | minuet ghost visible | dismiss AI suggestion |
| M-n / M-p | minuet ghost visible | next / previous AI suggestion |
| M-i | anywhere | minuet-show-suggestion (request AI completion now) |
| M-y | anywhere | minuet-complete-with-minibuffer (pick a completion) |
| M-x eglot | python / ts / js buffer | (re)start the language server manually |
The mouse also works: middle-click / mouse-2 on a corfu candidate inserts it. eglot adds its own context menu (mouse-3) with "Go to definition", "Rename", etc.
languages supported
- python
- eglot auto-starts
pyright(real LSP completion -> corfu) - typescript / javascript
- eglot auto-starts
typescript-language-serverfor .ts/.tsx/.js/.jsx and web-mode - R / web / org
- ESS, web-mode and org-native features provide their own completion sources
what runs when, and why no collision
- You type in a .py file. eglot connects to pyright (auto via
python-mode-hookeglot-ensure) and offers candidates. corfupops up the candidates. TAB or middle-click accepts one.- If a minuet ghost appears after the 0.5s debounce,
minuet-active-mode-maptakes over and TAB accepts the AI line instead.
corfu-auto is deliberately OFF so corfu does not pop up competing suggestions while minuet is generating. corfu appears on demand (TAB), minuet appears automatically.
installing the backends
# Python LSPs (see requirements.txt)
pip install -r requirements.txt
# TypeScript LSP (global pnpm so node_modules stays out of this repo)
pnpm add -g typescript typescript-language-server
The binaries must be on exec-path; emacs.el already adds the pnpm global bin dir.
helm
Legacy minibuffer-completion framework. Kept as an optional heavy fallback; currently commented out in emacs.el (see preferred setup).
(use-package helm ;;display completion
    :straight t
    :config
    )
ivy
Lighter minibuffer-completion framework (companion of helm). Optional alternate; commented out in emacs.el.
jupyter
Org-babel kernel support: run Jupyter notebooks / languages from Org source
blocks (where the jupyter executable is present).
(when (executable-find "jupyter")
  (org-babel-do-load-languages
   'org-babel-load-languages
   '((jupyter . t)))
  (define-key jupyter-org-interaction-mode-map (kbd "C-s-c h") #'jupyter-org-hydra/body)
  (define-key jupyter-org-interaction-mode-map (kbd "C-c h") nil))
additional
eglot snippet ement
orderless
Flexible, order-independent minibuffer/completion matching (space-separated substrings match in any order). Complements vertico/consult.
(use-package orderless)
clang-format
C language formatter
(use-package clang-format
    :commands (clang-format-buffer clang-format-on-save-mode))
(add-hook 'c-mode-hook 'clang-format-on-save-mode)
(add-hook 'c++-mode-hook 'clang-format-on-save-mode)
(add-hook 'glsl-mode-hook 'clang-format-on-save-mode)
corfu
Corfu basic
(use-package corfu ;; autocompletion
  :hook ((prog-mode . (lambda () (setq-local corfu-auto))
         (shell-mode . corfu-mode)
         (eshell-mode . corfu-mode))
  :init
  (global-corfu-mode)
  )
| corfu-mode |
More advanced options
(use-package corfu
  ;; :disabled
  :ensure t
  ;; Optional customization
  :custom
  (corfu-cycle t)                 ; Allows cycling through candidates
  (corfu-auto t)                  ; Enable auto completion
  (corfu-auto-prefix 10)
  (corfu-auto-trigger ".")
  (corfu-auto-delay 0.1)
  (corfu-popupinfo-delay '(0.5 . 0.2))
  (corfu-preview-current 'insert) ; insert previewed candidate
  (corfu-preselect 'prompt)
  (corfu-on-exact-match nil)      ; Don't auto expand tempel snippets
  ;; Optionally use TAB for cycling, default is `corfu-complete'.
  :bind (:map corfu-map
              ("M-SPC"      . corfu-insert-separator)
              ("TAB"        . corfu-next)
              ([tab]        . corfu-next)
              ("S-TAB"      . corfu-previous)
              ([backtab]    . corfu-previous)
              ("S-<return>" . corfu-insert)
              ("RET"        . nil))

  :init
  (global-corfu-mode)
  (corfu-history-mode)
  (corfu-popupinfo-mode)) ; Popup completion info
dabbrev
Enable key bindings
(global-set-key (kbd "M-/") 'dabbrev-expand)
(global-set-key (kbd "M-C-/") 'dabbrev-completion)
dabbrev-completion
cape
Completion-at-point functions (capf) that compose and enrich the completion sources corfu displays (file/history/pcomplete wrappers, eglot wiring).
(use-package cape
  :ensure t
  :defer 10
  :bind ("C-c f" . cape-file)
  :init
  ;; Add `completion-at-point-functions', used by `completion-at-point'.
  (defun my/add-shell-completion ()
    (interactive)
    (add-to-list 'completion-at-point-functions 'cape-history)
    (add-to-list 'completion-at-point-functions 'pcomplete-completions-at-point))
  (add-hook 'shell-mode-hook #'my/add-shell-completion nil t)
  :config
  ;; Make capfs composable
  (advice-add #'eglot-completion-at-point :around #'cape-wrap-nonexclusive)
  (advice-add #'comint-completion-at-point :around #'cape-wrap-nonexclusive)
  ;; Silence then pcomplete capf, no errors or messages!
  (advice-add 'pcomplete-completions-at-point :around #'cape-wrap-silent))
cape-file
hippie-exp
Heuristic dabbrev-style expansion (tries many sources: dabbrev, kill-ring, file names, Lisp symbols…). Fast, offline, always available.
(use-package hippie-exp
  :bind ([remap dabbrev-expand] . hippie-expand)
  :commands (hippie-expand)
  :custom
  (dabbrev-ignored-buffer-regexps '("\\.\\(?:pdf\\|jpe?g\\|png\\)\\'"))
  (dabbrev-upcase-means-case-search t)
  :config
  (setopt hippie-expand-try-functions-list
          '(tempel-expand
            try-expand-all-abbrevs
            try-expand-dabbrev
            try-expand-dabbrev-all-buffers
            try-expand-dabbrev-from-kill
            try-complete-lisp-symbol-partially
            try-complete-lisp-symbol
            try-complete-file-name-partially
            try-complete-file-name)))
what to actually run (preferred setup)
The alternates above (helm, ivy, orderless, the extra corfu options) are historical or optional. The preferred configuration for the machine you are on is decided by packages-recommended-for-hardware and applied manually with
packages-apply-recommended (see the subsections under code assistant):
- On a capable machine (gaming laptop / workstation, local LLM running):
full→ eglot + corfu + minuet auto-suggest. - When the UI lags, on an old/thin laptop, or with no local LLM available:
lite→ corfu + dabbrev, auto-suggest off (manualM-ionly).
Pick one tier and forget the rest; the others exist so the same emacs.el keeps working on every machine without edits.
LLM coding assistant
Language models without IDE capabilities have limited added value. We can in principle build a coding assistant within emacs but I prefer by now to use different coding assistant with different capabilities. My workflow:
- simple tasks
- and test every progress. Agents taking too many autonomous decisions are difficult to oversee
- little interpretation
- agents need to understand and wait for agreement
Well configured coding assistants don't need extreme performant models
- pi agent
- pi-coding-agent the one I'm currently use the most
- aideremacs
- aider too many interactions
- opencode
- opencode in emacs
More on
ollama chat
;; Ollama client helpers
(defun my/ollama-chat (prompt)
  "Send PROMPT to Ollama and show the response in a temp buffer."
  (interactive "sPrompt: ")
  (let* ((url-request-method "POST")
         (url-request-extra-headers
          '(("Content-Type" . "application/json")))
         (url-request-data
          (encode-coding-string
           (json-encode
            `(("model" . "llama3.2")
              ("stream" . :json-false)
              ("prompt" . ,prompt)))
           'utf-8))
         (buf (url-retrieve-synchronously "http://localhost:11434/api/generate")))
    (with-current-buffer buf
      (goto-char (point-min))
      (re-search-forward "^$")
      (forward-char 1)
      (let ((json-object-type 'alist))
        (message "%s" (alist-get 'response (json-read)))))
    (kill-buffer buf)))
;; Example command for Blender prompts
(defun my/blender-prompt (task)
  "Prepare a Blender instruction from TASK."
  (interactive "sBlender task: ")
  (my/ollama-chat
   (concat
    "Rewrite this as a concise Blender instruction: "
    task)))
(global-set-key (kbd "C-c o") #'my/ollama-chat)
(global-set-key (kbd "C-c b") #'my/blender-prompt)
;; Meta bindings for convenience
(global-set-key (kbd "M-a") #'save-buffer)
(global-set-key (kbd "M-s") #'save-buffer)
;; (unless (package-installed-p 'blender-mode)
;;   (package-install 'blender-mode))
;; (use-package 'blender-mode)
local LLM clients in emacs
Three Emacs clients talk to LLM backends; they are configured in
~/.emacs.d/llm.el (the LLM module) and ~/.emacs.d/.
gptel(code)- full-featured chat + tool/MCP integration, routed through
the gptel tools in
~/.emacs.d/gptel_tools.el. Lazy-loaded. ellama(reasoning/docs)- lightweight chat everywhere, providers +
helpers in
~/.emacs.d/ellama_setup.el, lazy-loaded byellama-load-and-call. ollama-buddy(Unsloth)- the direct client for the local Unsloth server (GGUF models) with a role/transient menu.
gptel
Key bindings (llm.el):
| Key | Command | Description |
|---|---|---|
C-c g |
gptel-load-and-call |
Load gptel+tools then run gptel |
C-c C-g |
gptel-send |
Send region/buffer to gptel |
C-c C-b |
my/gptel-blender-prompt |
Blender prompt helper (org-mode) |
gptel-load-and-call (llm.el) adds user-emacs-directory to the
load path, loads gptel_tools, binds C-c C-g, then invokes gptel. Tools
live in ~/.emacs.d/gptel_tools.el and allowed shell commands in
~/.emacs.d/gptel-allowed-commands.txt.
ellama
Lazy-loaded by ellama-load-and-call (llm.el) from
~/.emacs.d/ellama_setup.el. Supports dynamic provider discovery (defaults
to Unsloth's /api/inference/models, needs UNSLOTH_TOKEN) and a C-c e
prefix keymap. C-x e is left for macro-execute. See agent_call for
the full provider/command breakdown.
ollama-buddy
Configured in llm.el (the LLM module).
- Default model:
unsloth/gemma-4-E2B-it-GGUF - Host/port:
localhost:~8889~ (the local Unsloth server) - Auth:
UNSLOTH_TOKEN(API key) - Convert markdown replies to Org (
t), streaming (t), auto-scroll (t), max file size 10MB.
| Key | Command | Description |
|---|---|---|
C-c o |
ollama-buddy-role-transient-menu |
Role-based chat menu |
C-c O |
ollama-buddy-transient-menu |
Full ollama-buddy menu |
Note: a very old ollama chat helper above historically bound C-c o to a
hardcoded llama3.2 call; that binding is superseded by ollama-buddy.
aider emacs
(use-package aidermacs
    :ensure t
    :bind (("C-c f x" . aidermacs-transient-menu))
    :config (setenv "OLLAMA_API_BASE" "http://127.0.0.1:11434")
    :custom
    (aidermacs-default-chat-model 'code)
    (aidermacs-default-model "ollama_chat/qwen3.5:9b"))
(defun my-aider-add-related (query)
  (interactive "sSearch context: ")
  (let* ((cmd (format "rg -l \"%s\"" query))
         (files (split-string (shell-command-to-string cmd) "\n" t))
         (aider-cmd
          (concat "aider " (mapconcat #'identity files " "))))
    (vterm)
    (vterm-send-string aider-cmd)
    (vterm-send-return)))
elmo
(defun elmo-python-code ()
  "Function to integrate ELMo-like functionality using Python."
  (interactive)
  ;; Assuming you have a Python script that interacts with ELMo and
  returns results.
  (let ((python-eldoc-buffer (make-temp-file "elmocode" nil t)))
    (with-current-buffer python-eldoc-buffer
      (insert "#!/usr/bin/env python3\n"
              "import json\n"
              "\n"
              "def elmo_functionality(text):\n"
              f"   # Dummy ELMo function that returns a JSON
              object. Replace with actual ELMo call.\n"
              f"   return {json.dumps({'result': 'processed
              text'})}\n"
              "\n"
              "result = elmo_functionality('"'"'Your input text
              here'"'"')\n")
      (write-region nil nil python-eldoc-buffer)
      (shell-command (concat "chmod +x " python-eldoc-buffer))
      (call-process-shell-command
       python-eldoc-buffer
       :stderr nil
       :read-only t
       :treat-piped-output-as-errors nil))
    ;; Now you can access the result in your current buffer.
    (message "ELMo function call completed. Result is accessible via `M-x elmo-python-code`")
    ))
(global-set-key (kbd "<f12>") 'elmo-python-code)
interactive programming
Emacs has many code REPL features were you can send lines of code and test the execution and the data transformation. I mainly use REPL with:
- python
- I can access all the methods and help in the panel
- IoT
- I can open a serial terminal
- nodejs
- I can test promises too
- R
- visualize on the fly the results
- octave
- for more complex mathematical functions
- lisp
- elisp:(ieml)
other packages
treesit
Source code into syntax tree
- activate
- elisp:(tree-sitter-mode)
(use-package treesit-auto)
(use-package tree-sitter)
(use-package tree-sitter-org
  :straight (:host github :type git :repo "Idorobots/tree-sitter-org" )
  )
t
ido-mode
bot review
The provided Emacs configuration file demonstrates a comprehensive setup tailored for efficient coding and development. The work encompasses various features that enhance productivity, code management, and collaboration within the software lifecycle.
Key Features:
- Customization and Personalization:
- Themes: Uses the 'misterioso' theme with custom colors to improve visual comfort.
- Font Settings: Adjustable font size through global shortcuts for better readability.
- Transparency Control: Toggle transparency settings with `C-c l`.
- Package Management:
- Extensive Package List: Includes packages like `gptel`, `eradio`, `ess-R-data-view`, and more, tailored for development needs.
- Auto-Install and Update: Packages are managed using MELPA, ensuring up-to-date features and tools.
- Code Mode Enhancements:
- Multiple Language Support: Extensive support for languages including R, Python, JavaScript, CSS, HTML, PHP, etc., with mode-specific functionalities like indentation and beautification.
- Interactive Code Execution: Features like running code snippets directly from Emacs buffers for quick testing and prototyping.
- Development Tools:
- Version Control Integration: Basic backup settings to prevent data loss.
- Desktop Mode: Restores open buffers across sessions, enhancing productivity.
- Shell Interactions: Enhanced shell modes for better integration with Node.js and Python.
- Project Management:
- Projectile Integration: For managing projects efficiently, particularly useful with `platformio-mode`.
- Keybindings for common project tasks like building, uploading, serial communication, and cleaning.
- AI and LLM Integration:
- Ellama (formerly gptel) for AI-driven coding assistance, enabling features like code review, summarization, translation, and more.
- Minuet for inline code suggestions using AI models.
- Spelling and Documentation:
- Flyspell integration for on-the-fly spelling correction in text and markdown modes.
- ESS (Emacs Speaks Statistics) for R development with enhanced interactivity.
- Custom Functions and Commands:
- Various custom functions like `my-python-auto-run`, `toggle-transparency`, and more, tailored to specific workflows.
- Keybindings for quick access to features like running Python code snippets or toggling transparency.
Usage and Importance:
- Enhanced Productivity: Features like auto-completion, inline suggestions, and AI-driven assistance significantly reduce the time spent on repetitive tasks and improve overall coding efficiency.
- Collaboration: Tools like `gptel` facilitate real-time collaboration with developers and stakeholders, enabling quick feedback and discussions.
- Learning and Development: Comprehensive language support and documentation tools encourage continuous learning and skill development.
- Error Prevention: Features like flyspell help catch spelling errors early in the coding process, reducing bugs.
Overall, this configuration represents a robust setup for modern software development using Emacs. It integrates various features that cater to different aspects of the software lifecycle, from initial planning and coding to deployment and documentation, making it an essential tool for developers seeking an efficient and flexible development environment.
2026
2026-07 July
2026-07-24 Friday
- customize face
Entered on
file:///home/sabeiro/lav/src/spiega/emacs/emacs.el#MissingReference
- binding hooks
Entered on
file:///home/sabeiro/lav/src/spiega/emacs/emacs.el#MissingReference
- environment
Entered on
file:///home/sabeiro/lav/src/spiega/emacs/emacs.el#MissingReference
- packages
Entered on
file:///home/sabeiro/lav/src/spiega/emacs/emacs.el#MissingReference
- interface
Entered on
- modes
Entered on
- org-mode settings
Entered on
- autocomepletion
Entered on
- coding assistant
Entered on
- interactive coding
Entered on
- LLM assistance
Entered on
- multimedia
Entered on
bot review
The provided Emacs configuration file demonstrates a comprehensive setup tailored for efficient coding and development. The work encompasses various features that enhance productivity, code management, and collaboration within the software lifecycle.
### Key Features:
- Customization and Personalization:
- Themes: Uses the 'misterioso' theme with custom colors to improve visual comfort.
- Font Settings: Adjustable font size through global shortcuts for better readability.
- Transparency Control: Toggle transparency settings with `C-c l`.
- Package Management:
- Extensive Package List: Includes packages like `gptel`, `eradio`, `ess-R-data-view`, and more, tailored for development needs.
- Auto-Install and Update: Packages are managed using MELPA, ensuring up-to-date features and tools.
- Code Mode Enhancements:
- Multiple Language Support: Extensive support for languages including R, Python, JavaScript, CSS, HTML, PHP, etc., with mode-specific functionalities like indentation and beautification.
- Interactive Code Execution: Features like running code snippets directly from Emacs buffers for quick testing and prototyping.
- Development Tools:
- Version Control Integration: Basic backup settings to prevent data loss.
- Desktop Mode: Restores open buffers across sessions, enhancing productivity.
- Shell Interactions: Enhanced shell modes for better integration with Node.js and Python.
- Project Management:
- Projectile Integration: For managing projects efficiently, particularly useful with `platformio-mode`.
- Keybindings for common project tasks like building, uploading, serial communication, and cleaning.
- AI and LLM Integration:
- Ellama (formerly gptel) for AI-driven coding assistance, enabling features like code review, summarization, translation, and more.
- Minuet for inline code suggestions using AI models.
- Spelling and Documentation:
- Flyspell integration for on-the-fly spelling correction in text and markdown modes.
- ESS (Emacs Speaks Statistics) for R development with enhanced interactivity.
- Custom Functions and Commands:
- Various custom functions like `my-python-auto-run`, `toggle-transparency`, and more, tailored to specific workflows.
- Keybindings for quick access to features like running Python code snippets or toggling transparency.
Usage and Importance:
- Enhanced Productivity: Features like auto-completion, inline suggestions, and AI-driven assistance significantly reduce the time spent on repetitive tasks and improve overall coding efficiency.
- Collaboration: Tools like `gptel` facilitate real-time collaboration with developers and stakeholders, enabling quick feedback and discussions.
- Learning and Development: Comprehensive language support and documentation tools encourage continuous learning and skill development.
- Error Prevention: Features like flyspell help catch spelling errors early in the coding process, reducing bugs.
Overall, this configuration represents a robust setup for modern software development using Emacs. It integrates various features that cater to different aspects of the software lifecycle, from initial planning and coding to deployment and documentation, making it an essential tool for developers seeking an efficient and flexible development environment.