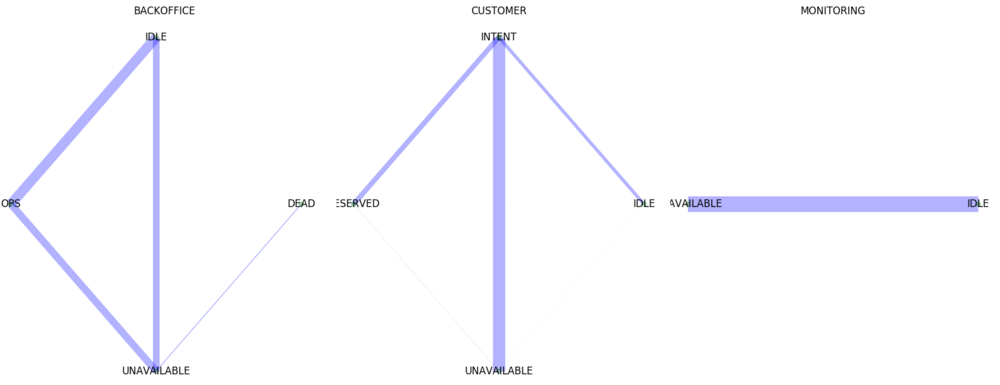
 user behaviour on status
We group the redundant information organizing the time variant
information into a matrix called tx and summarize the
dynamic quantities in their appropriate column
| id_scooter | usertype | bound | dt | id_zone | locked | mileage | n | state | tx |
|---|---|---|---|---|---|---|---|---|---|
| 861319030001038 | CUSTOMER | [12.518, 55.6737, 12.5518, 55.6819] | 3247 | copenhagen | [True, False, False, True, False, False] | 1291 | 6 | [INTENT_RESERVED, RESERVED, UNAVAILABLE_FOR_RE… | [[1568028254, 12.5518, 55.6819, 99], [… |
We can than cluster user behaviour
 user behaviour on status
We can aggregate information for each ride
| tx | bounding box | lenght | energy_consumption | n | cost | zoneid | firmware |
|---|---|---|---|---|---|---|---|
| [[1568028254, 12.5518, 55.6819, 99], [… | [12.518, 55.6737, 12.5518, 55.6819] | 25 | 2.5 | berlin | 01_02_02_00_0306 |
Where the dynamic matrix is
tx = [x,y,timestamp,energy,milage,speed,speed_limit]
We can than calculate the rides over two months
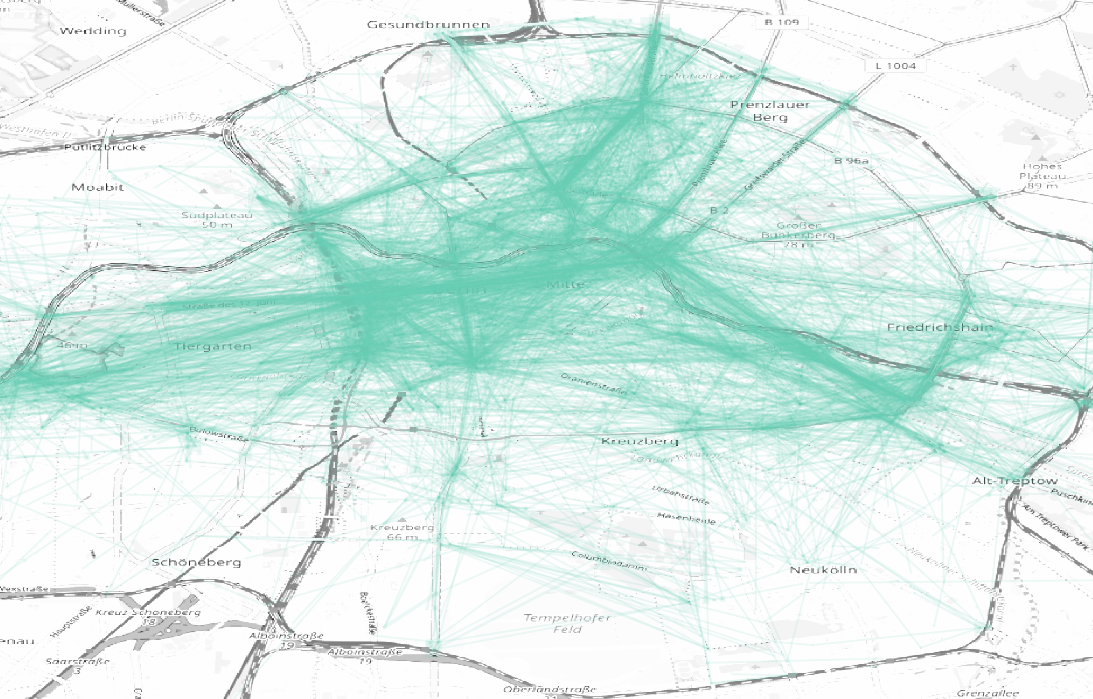 rides on map
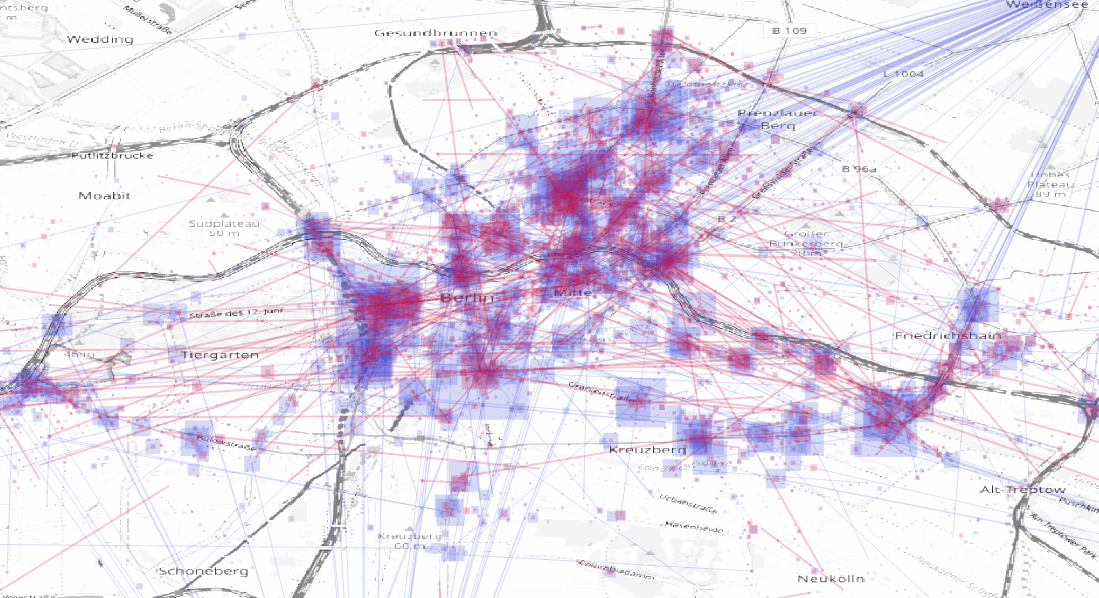 rides monitoring
We can sum up rides per geohash
 rides on geohash
And calculate the origin/destination matrix
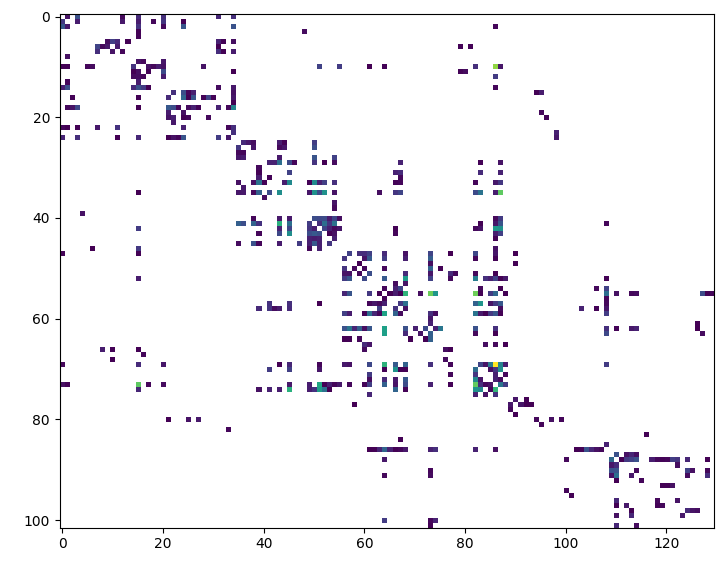 origin
destination matrix
We can than calculate a simplified graph of the customer movements
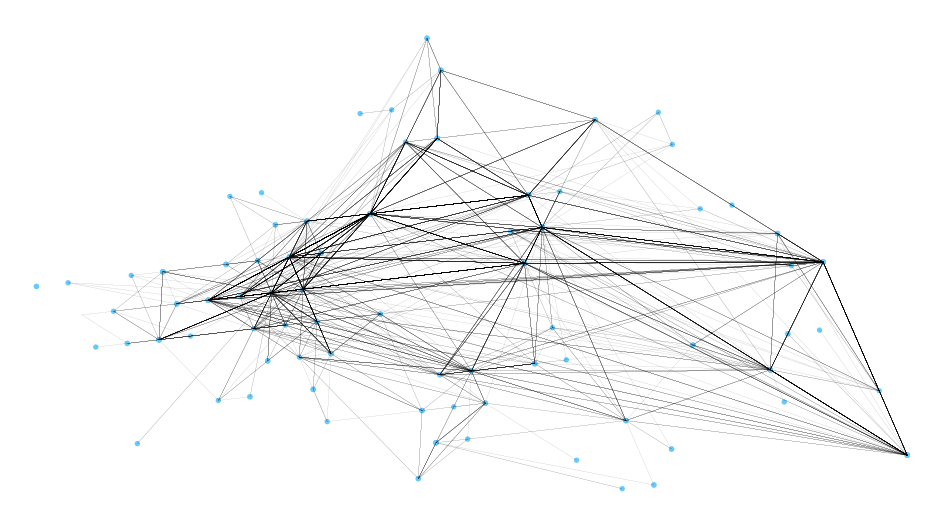 customer movements on graph
The hardware api is the table that contains all the communication with the hardware.
The table is updated every connection
For each scooter we can sum up idle time, revenues…
| idle_time | total_revenue | bounding box | [id rides] | firmware | zoneid | milage | num_turs | num_deployments | |
|---|---|---|---|---|---|---|---|---|---|
| 10:20:24 | 3.4 | [12.518, 55.6737, 12.5518, 55.6819] | [4q3wfrg,qt4fr34q3] | 01_02_02_00_0306 | berlin | 23 | 2 | 1 |
tx = [deployment location,downstream revenue,downstream turns]
For each customer during the day we can counts how many rides, operation area…
| n_rides | bounding box | revenue | zoneid |
|---|---|---|---|
| 1 | [12.518, 55.6737, 12.5518, 55.6819] | 2.4 | berlin |
    import pyarrow.parquet as pq
    import s3fs
    s3 = s3fs.S3FileSystem()
    hapi = pq.ParquetDataset('s3://'+buck,filesystem=s3).read_pandas().to_pandas()
    del hapi['deviceenergylevel'], hapi['id'], hapi['version'], hapi['gnssupdatedat'], hapi['deviceenergylevel'], hapi['iccid'], hapi['signalstrength'], hapi['lambda_time'], hapi['kinesis_input_time'], hapi['iotprovider'], hapi['imei'], hapi['iotid']
hapi.to_csv(baseDir + "raw/ride/hapi.csv.gz",index=False,compression="gzip")libraries
sc = pyspark.SparkContext.getOrCreate()
from pyspark.sql import SQLContext
from pyspark.sql.types import *
from pyspark.sql.functions import udf
import matplotlib.pyplot as plt
from pyspark.sql.functions import to_utc_timestamp, from_utc_timestamp
from pyspark.sql.functions import date_format
from pyspark.sql import functions as func
sqlContext = SQLContext(sc)
conf
os.environ["SPARK_HOME"] = "/usr/hdp/current/spark-client"
conf = SparkConf()
conf.setMaster('yarn-client')
conf.setAppName('a')
conf.set("spark.executor.memory", "8g")
conf.set("spark.executor.cores", "2")
conf.set("spark.executor.instances", "100")
data structure
parquet vectorized
user defined functions
def get_val(steps):
    xV = [float(x['y']) for x in steps if not x['y'] == "None"]
    return float(np.average(xV))

ud../f/f_get_val = udf(get_val,FloatType())
df = df.withColumn("y",ud../f/f_get_val("steps"))
joins on the pivoted tables will be faster, even periodic reports
We look at the distribution of revenues:
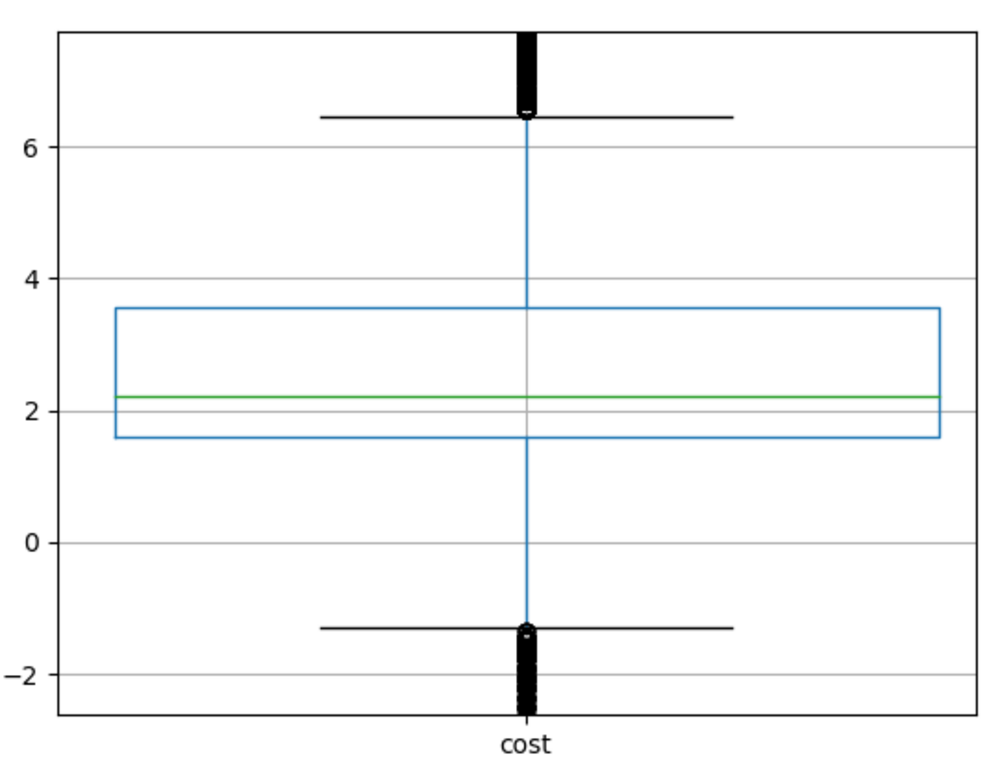 revenue boxplot
