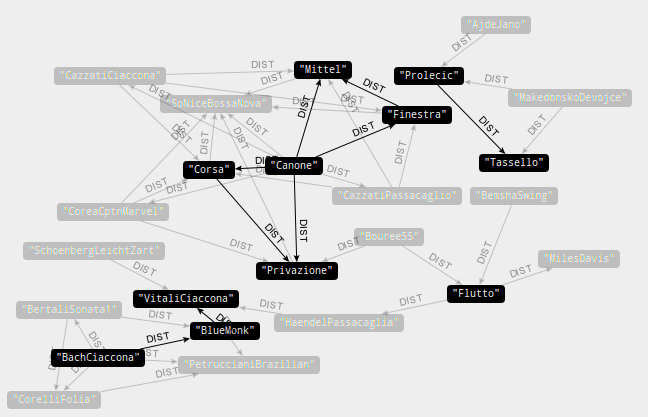
 distance between songs
E = − ∑ipilog pi
For each midi I consider the information contained in rhythm, chromatism and the total one. I compute the histograms relative to each single note duration and picth, separately and jointly.
| Song | rhythmic | cromatic | total |
|---|---|---|---|
| Flutto | 2.024 | 5.239 | 6.56 |
I compute the relative distances between songs:
dij2 = (Eir−Ejr)2 + (Eic−Ejc)2 + (Eit−Ejt)2
and build the graph in neo4j for those songs whose distance is inferior of 0.5.
CREATE (Entropy:Measure {label:'measure for creativity'})
CREATE (Aere:Song { id:'0', name:'Aere', entropy:'4.962'})
CREATE (AjdeJano) - [:DIST{d: 0.470}] -> (Prolecic),
distance between songs
You can see a clear connection to the songs which is pretty much the one we expect.
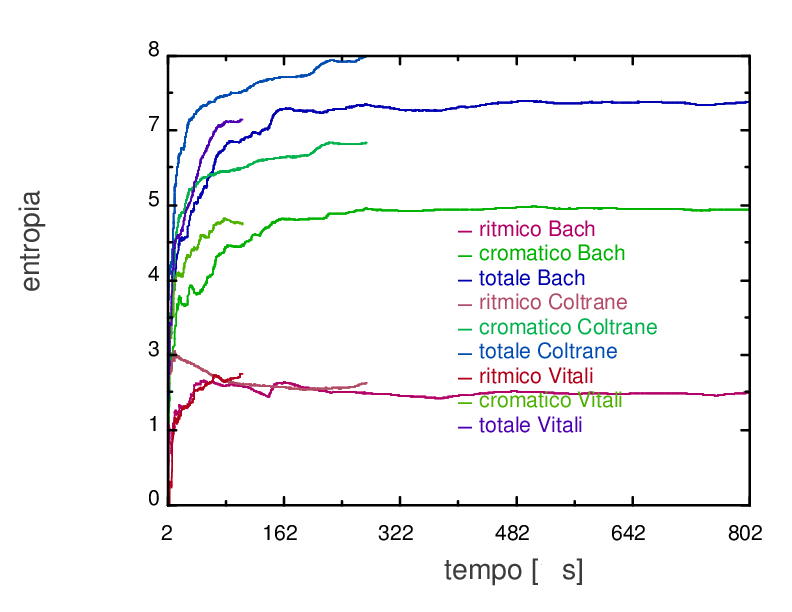
The evolution of entropy depends on the author and stabilizes over time, in same cases it shrinks.
 evolution of
entropy
In the graph Bach’s ciaccone, lazy bird of Coltrane and Vitali ciaccona where analyzed.
