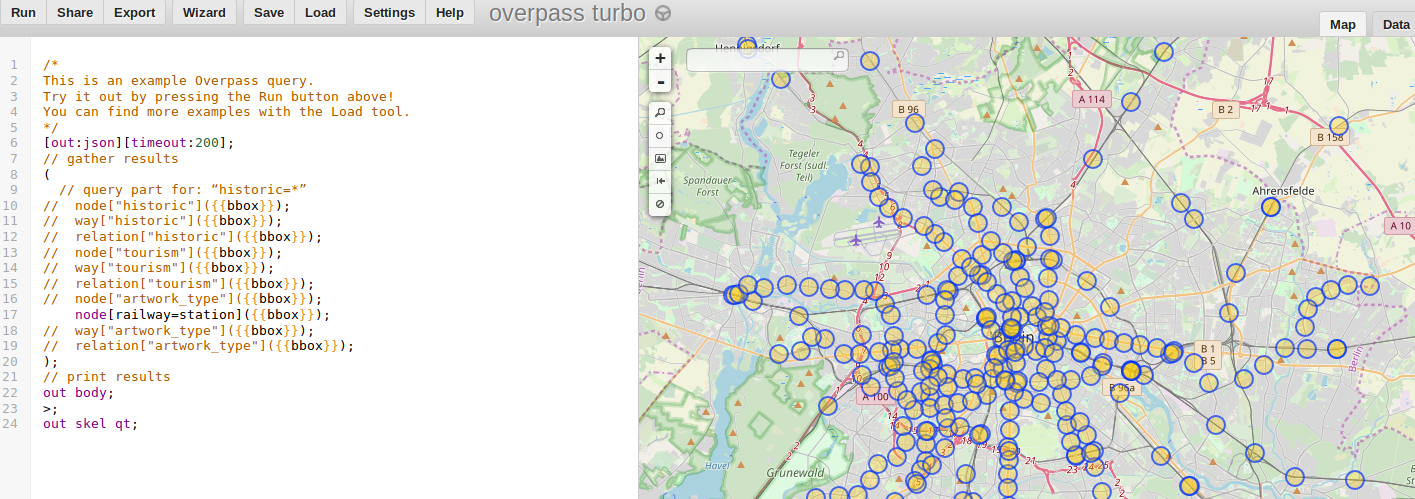
We run a series of queries on overpass turbo to get the most important features per city

running a query on overpass
We create a buffer around the new points and we dissolve the layer into a single multipolygon
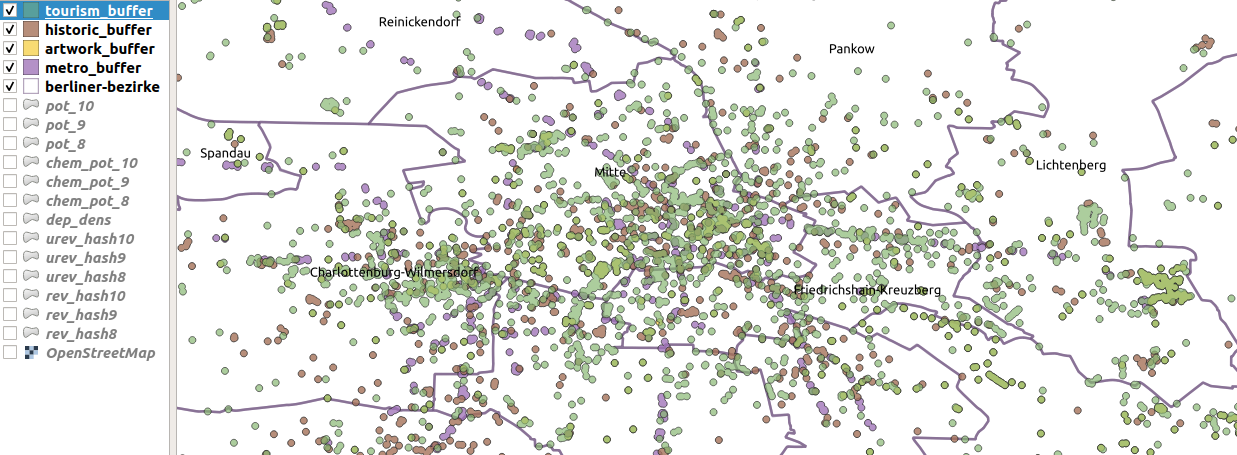
we have different layers showing the most important city features
We calculate the distance from the closest polygon and label them by customer segment
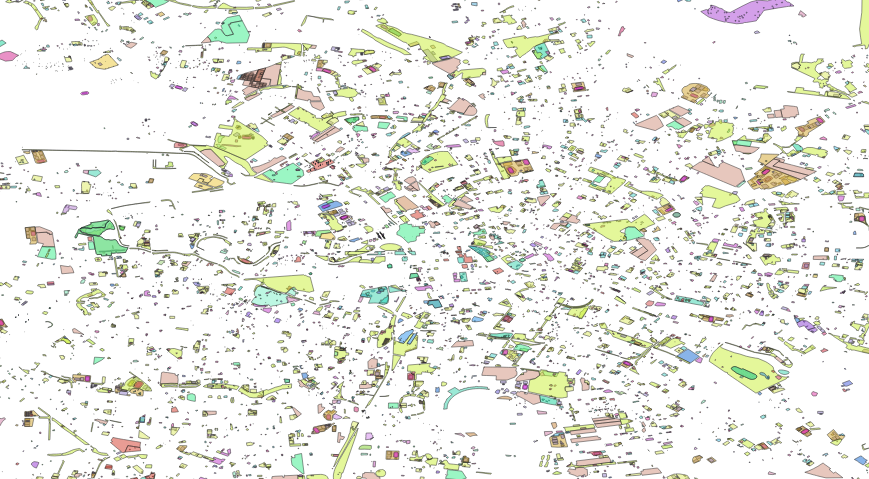
we have different layers showing the public spaces
We calculate correlation between features
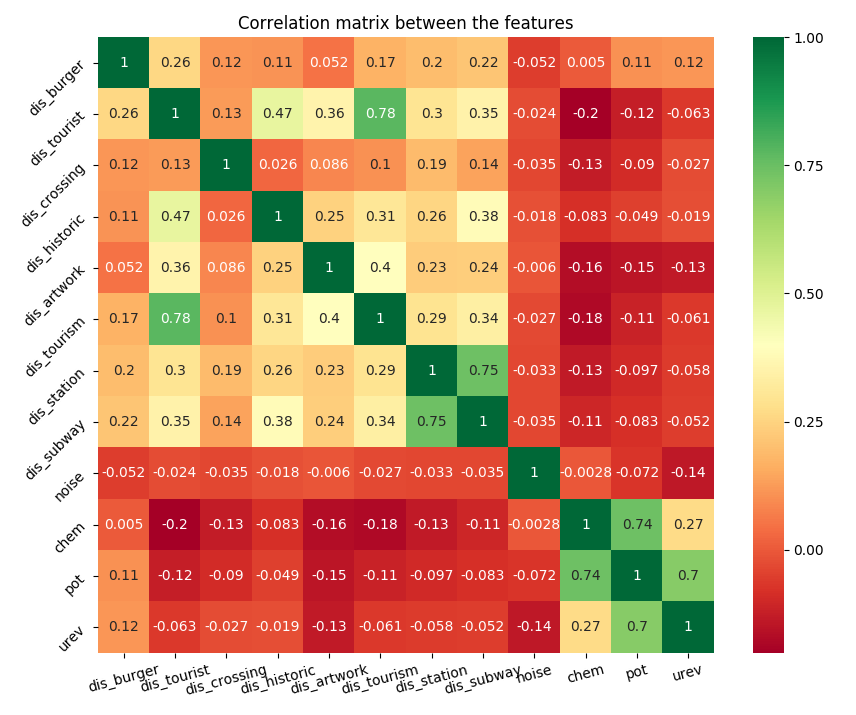
correlation between features and distances
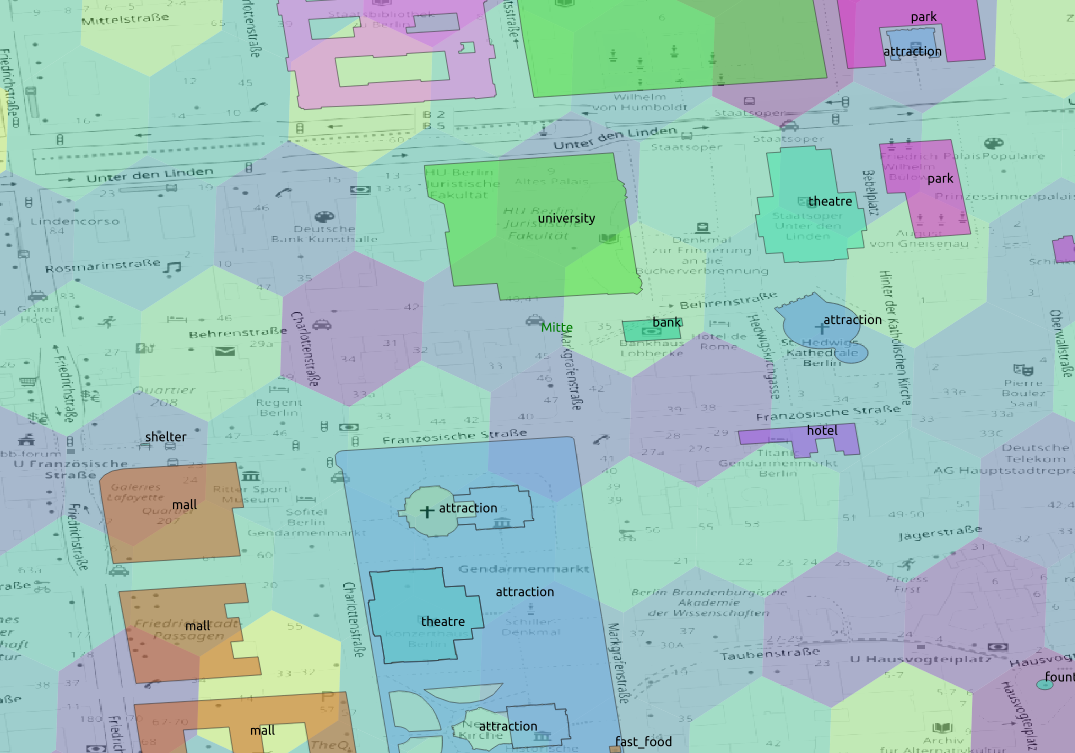
feature and spot overlapping
We enrich poi information with official statistical data like:
We don’t know a priori which parameter is relevant for learning and we might have surprisingly perfomances from features that do not seem to have connection with the metric.
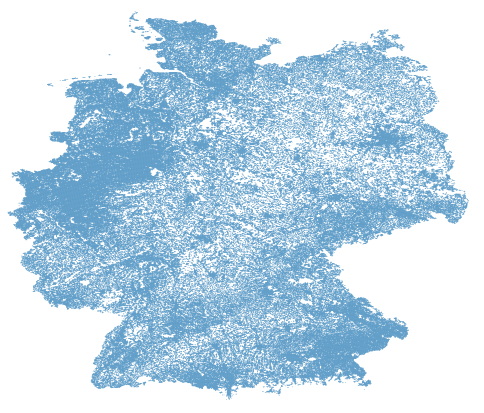
distribution of official census data
To obtain the value of population density we interpolate over the neighboring tiles with official census data using a stiff multiquadratic function.
Distribution of expense power across the city
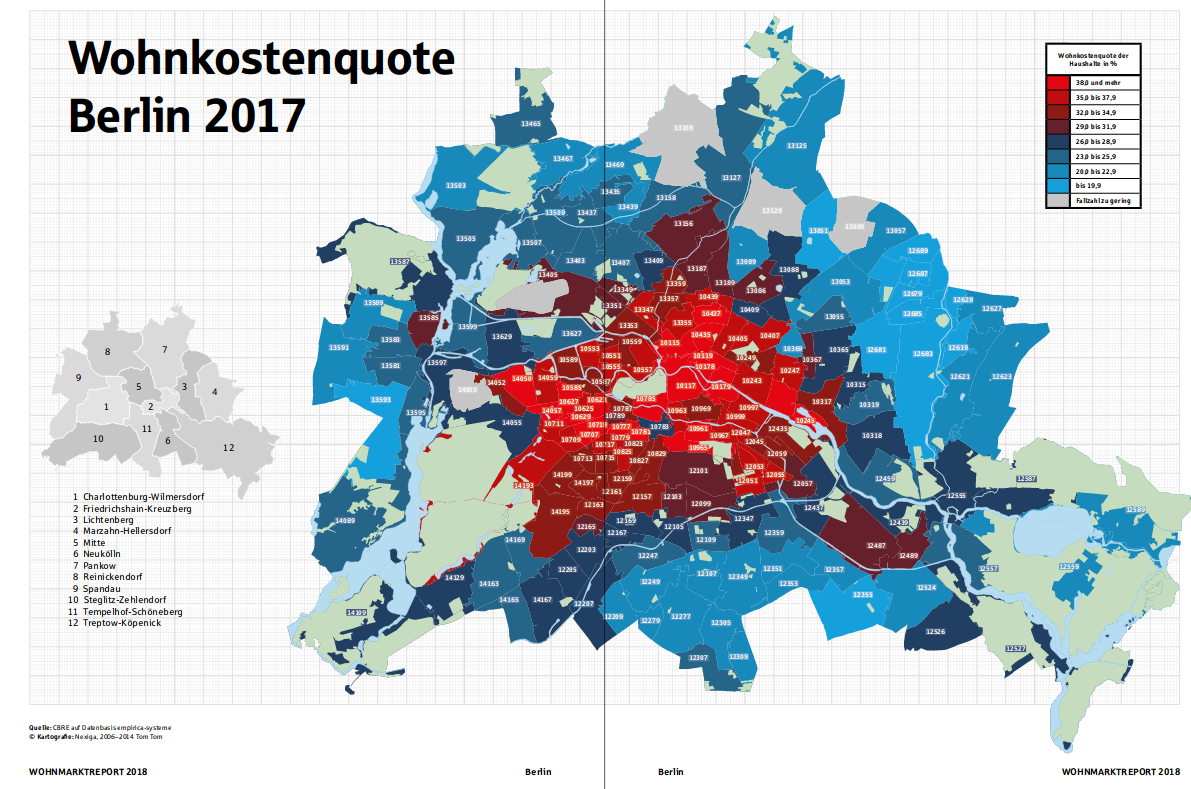
expense power
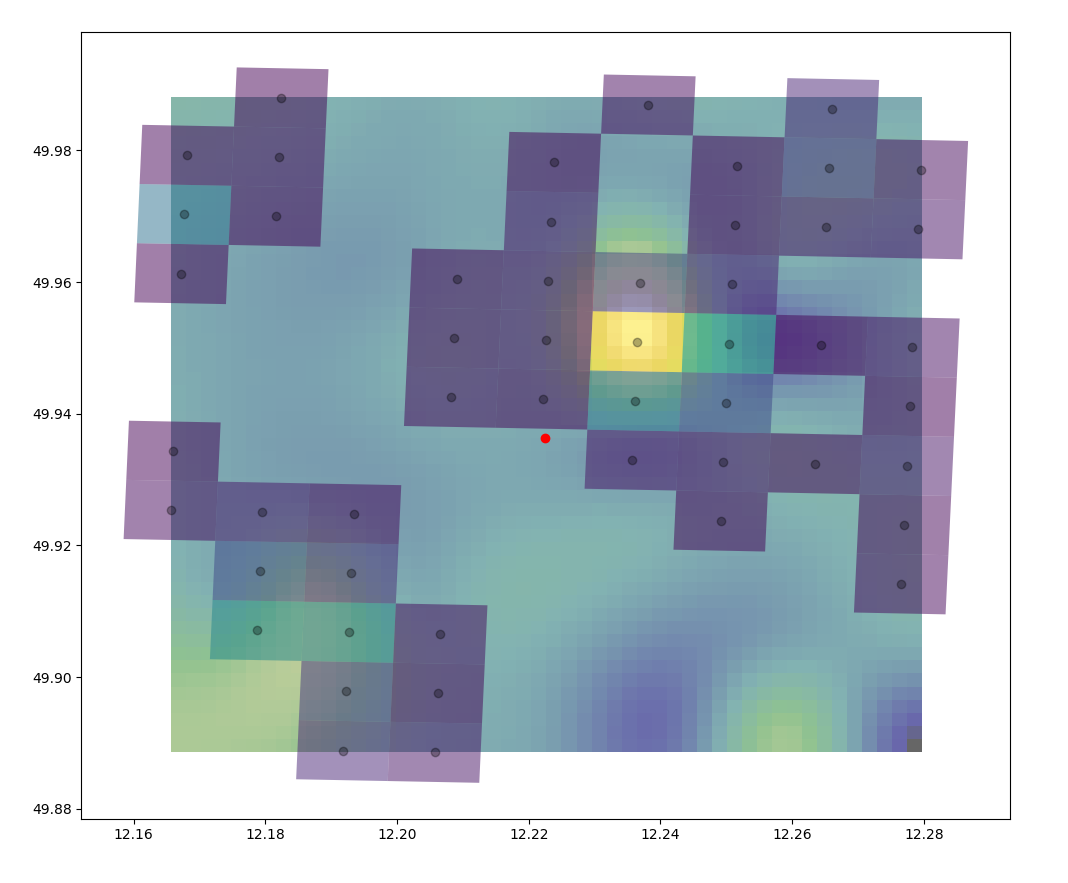
determination of the density value coming from the neighboring tiles of the official statistics
We than obtain an approximation on smaller geometries
 population density interpolation
And obtain an estimation on percentage of foregners, flat use, land use…
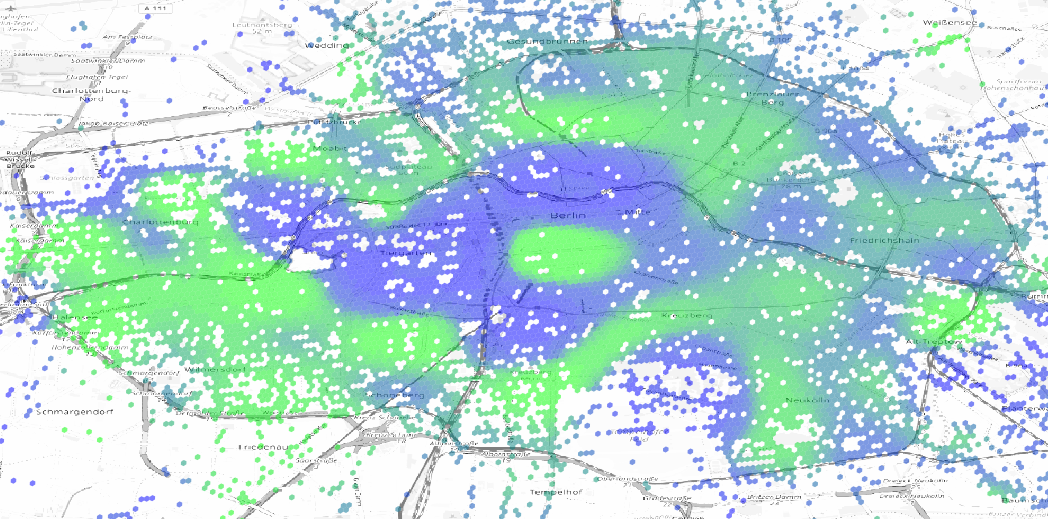
foreign distribution
Degeneracy is a measure of sparsity or replication of states, in this case we use the term to define the recurrency of pois in a spatial region.
The operative definition is to calculate the distribution of other pois at a certain distance. To reduce the complexity of the metric we perform a parabolic interpolation and define the degeneracy as the intercept of the parabola fitting the radial density distribution.
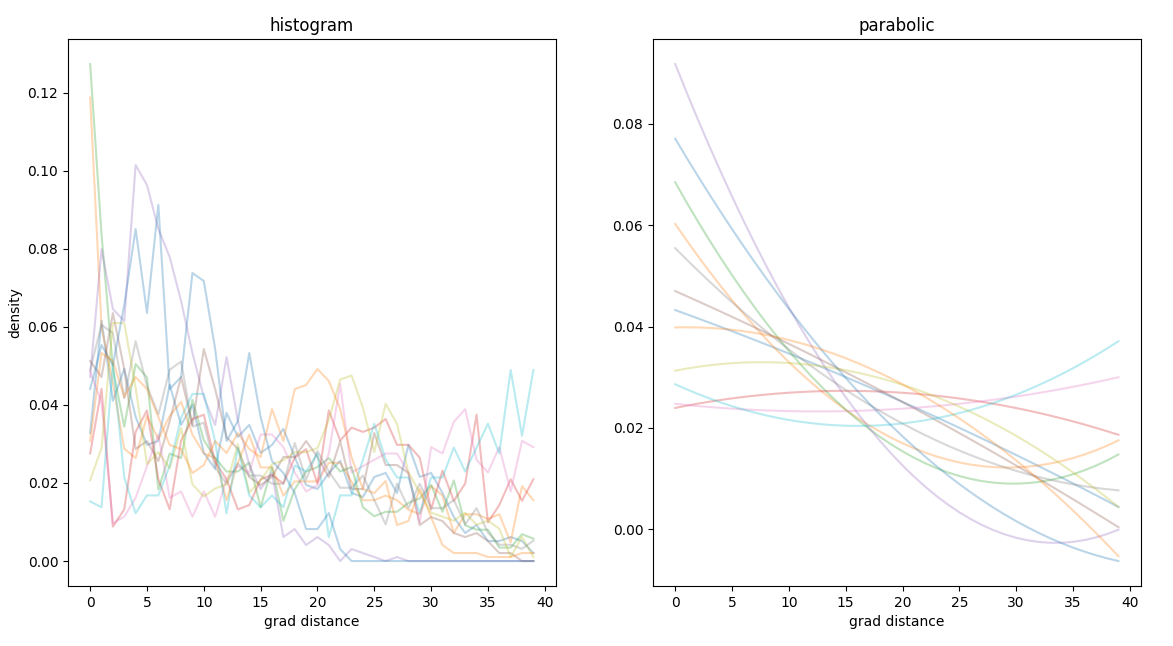
spatial degeneracy, only the intercept is taken into consideration
For each location we download the local network and calculate the isochrones
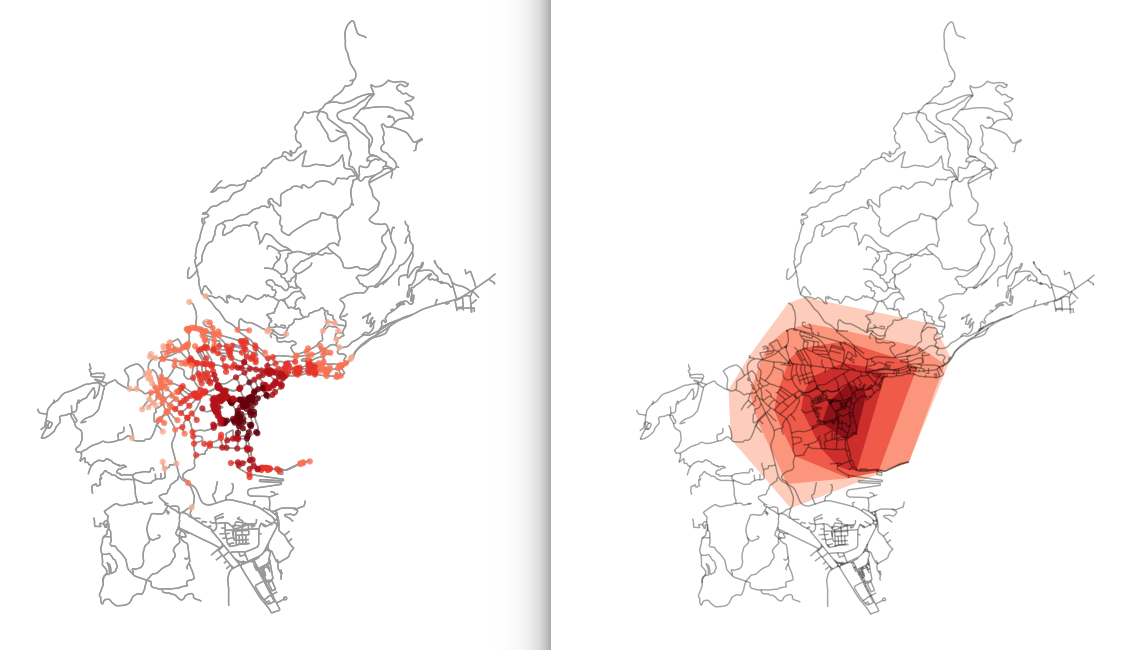
isochrone, selected nodes and convex hulls
In the literature there are different examples of spatial forecast prediction property values.
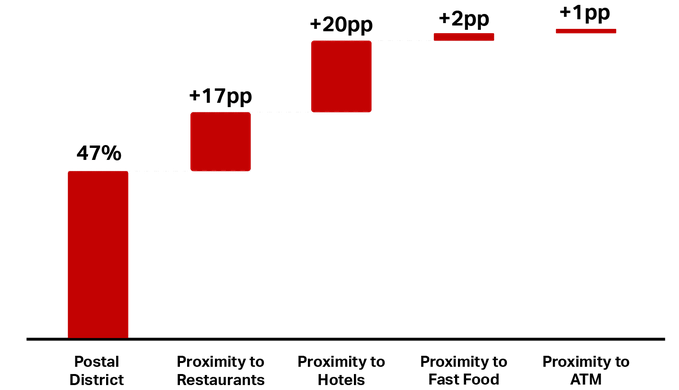
property prediction
