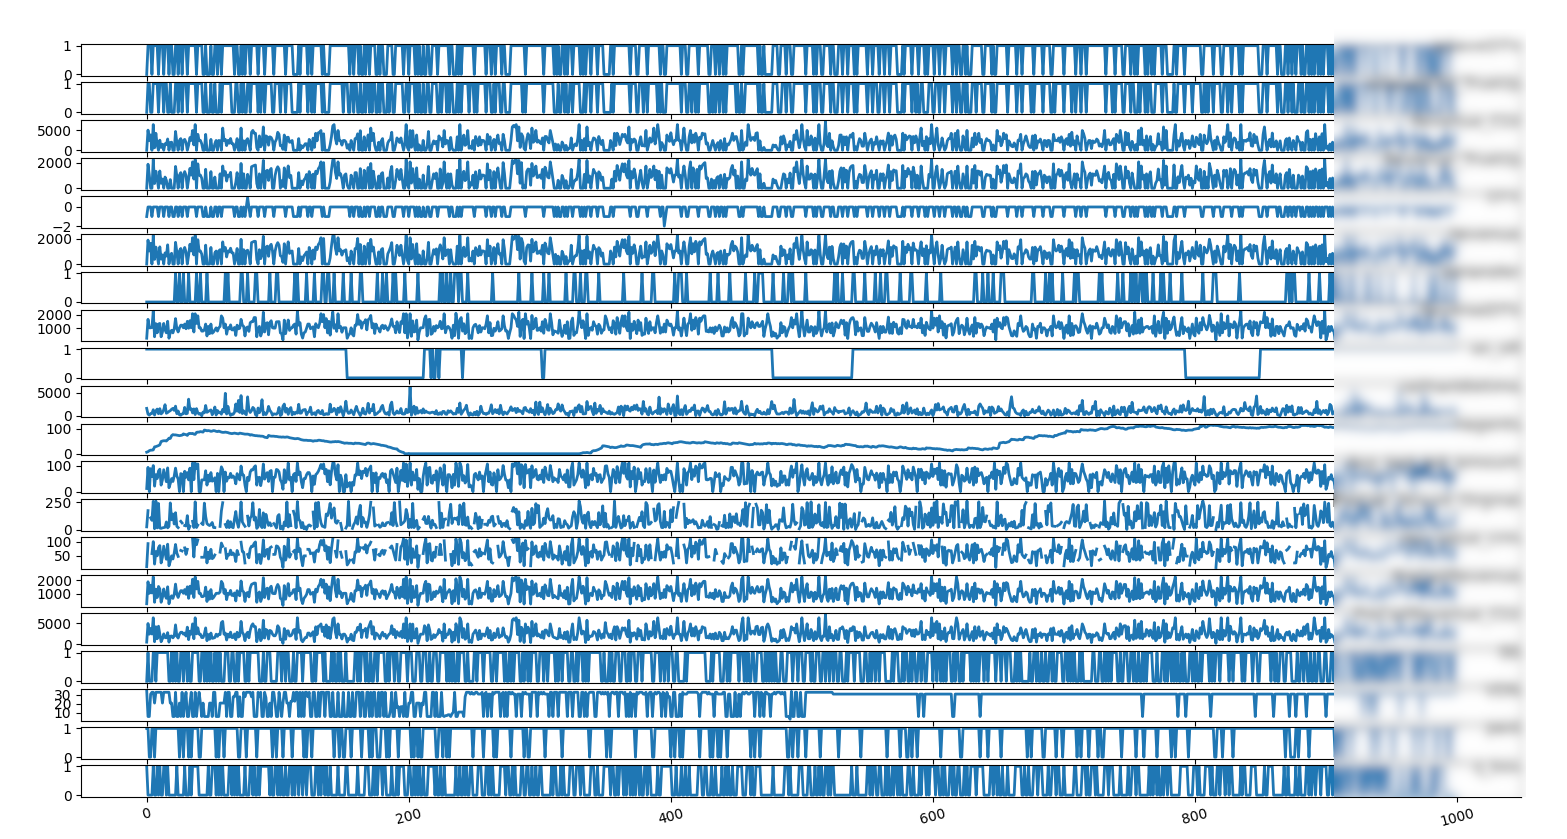
 time series of on-call and lagged metrics
In this project we want to investigate main differences between the metrics on the call and lagged metrics
The lagged metrics considers a time span of 25 days when the customer could call again and turn around. The lagged metric loses around 10% customers
 time series of on-call and lagged metrics
We have different metrics to predict
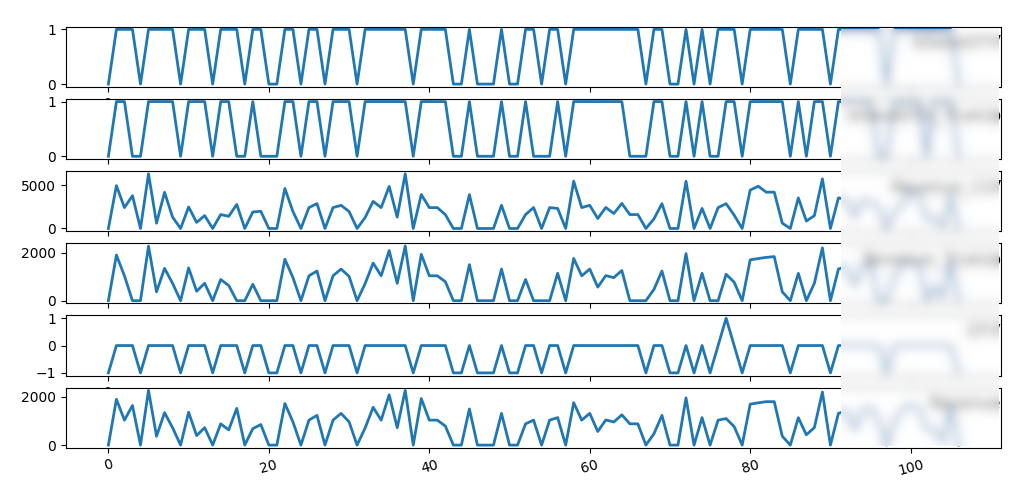 metrics to predict, on call and lagged
We clean the features
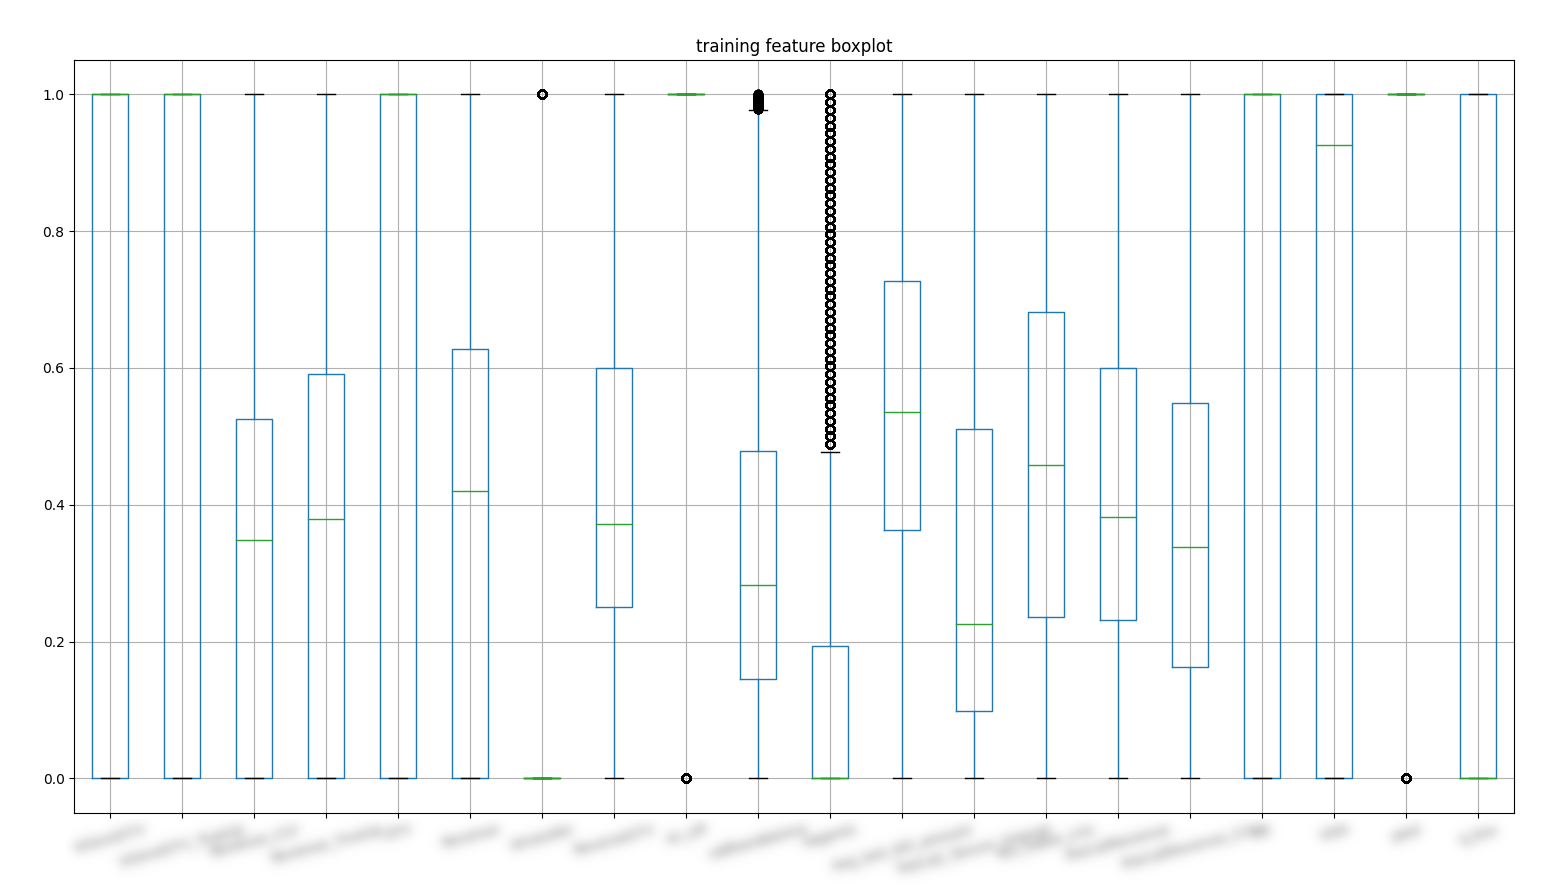 normalized feature distribution
We check the feature independency
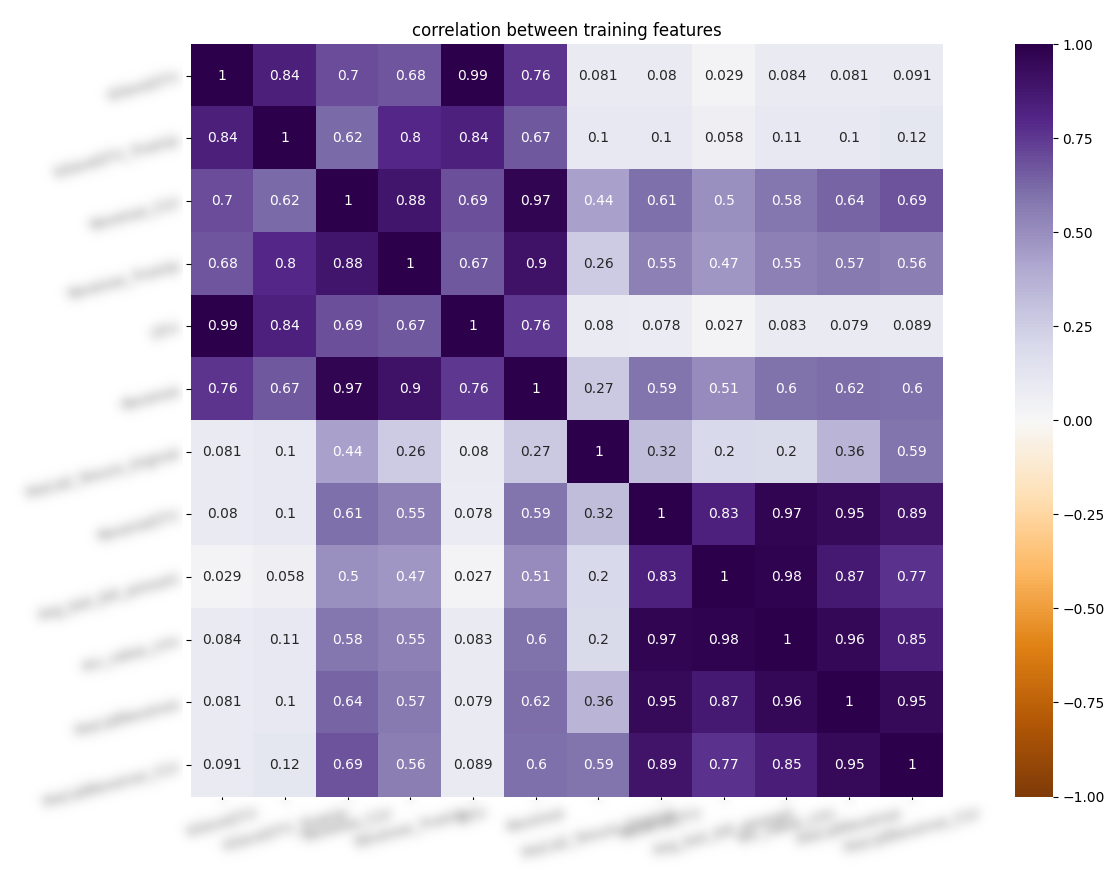 correlation between features
Effect of afiniti agent on feature distribution
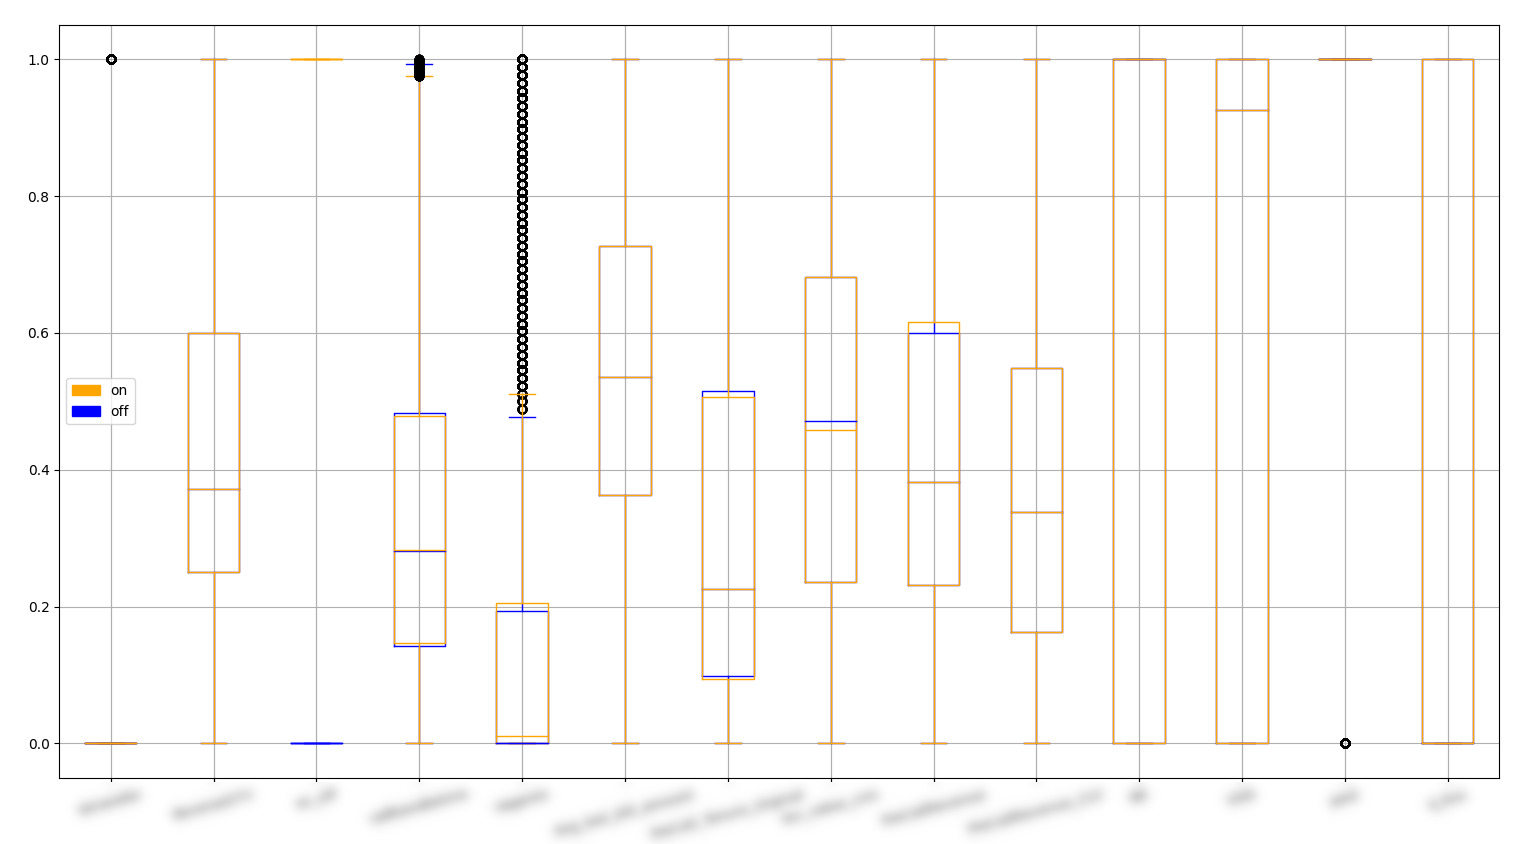 overlay of feature distribution
Overlay distribution of features on saved customers
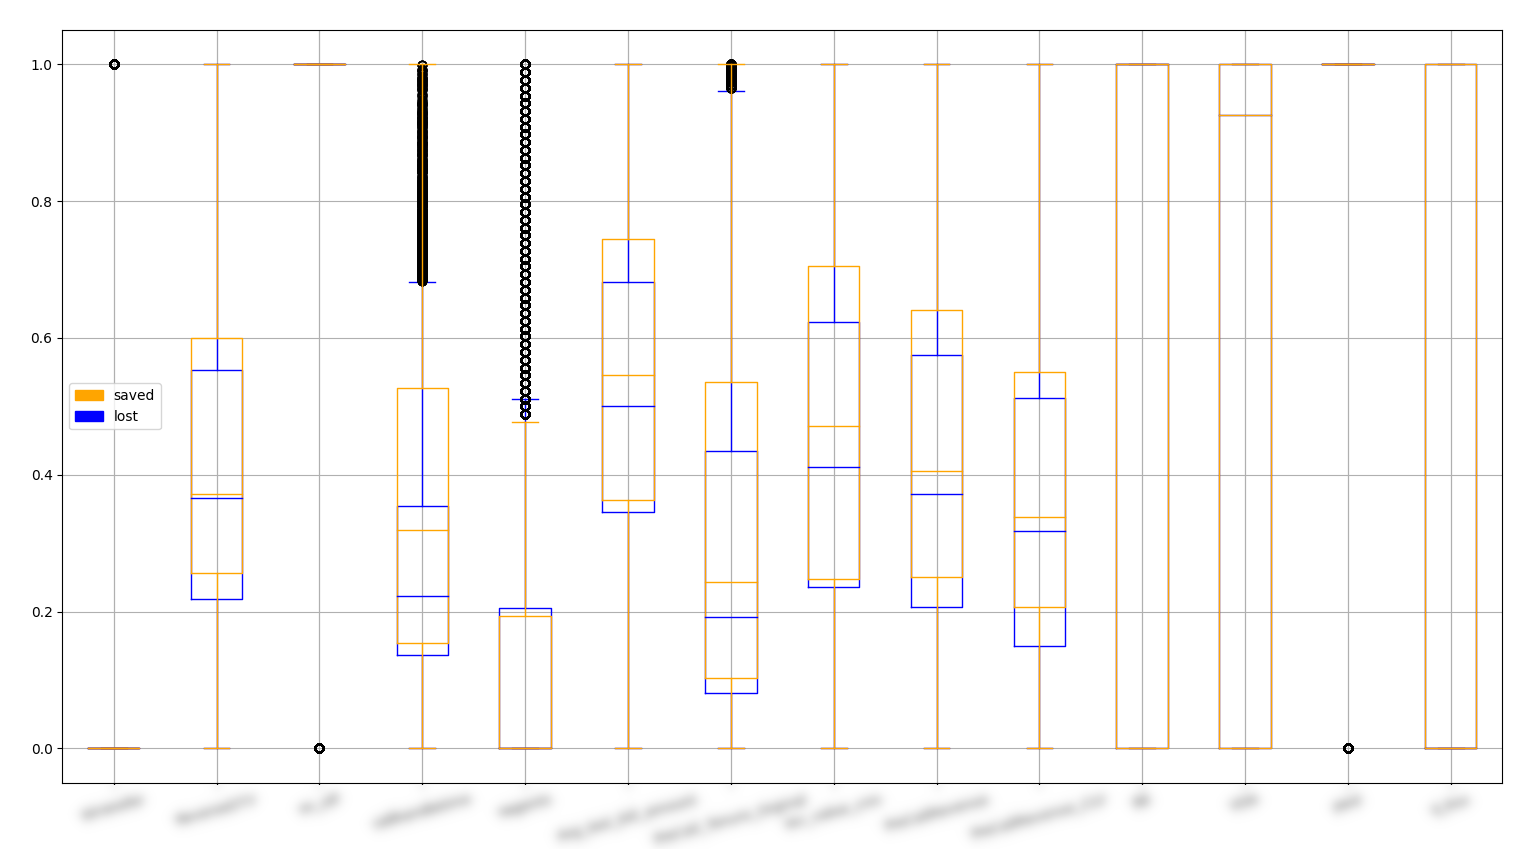 overlay of feature distribution
Overlay distribution of featured of saved/lost customers
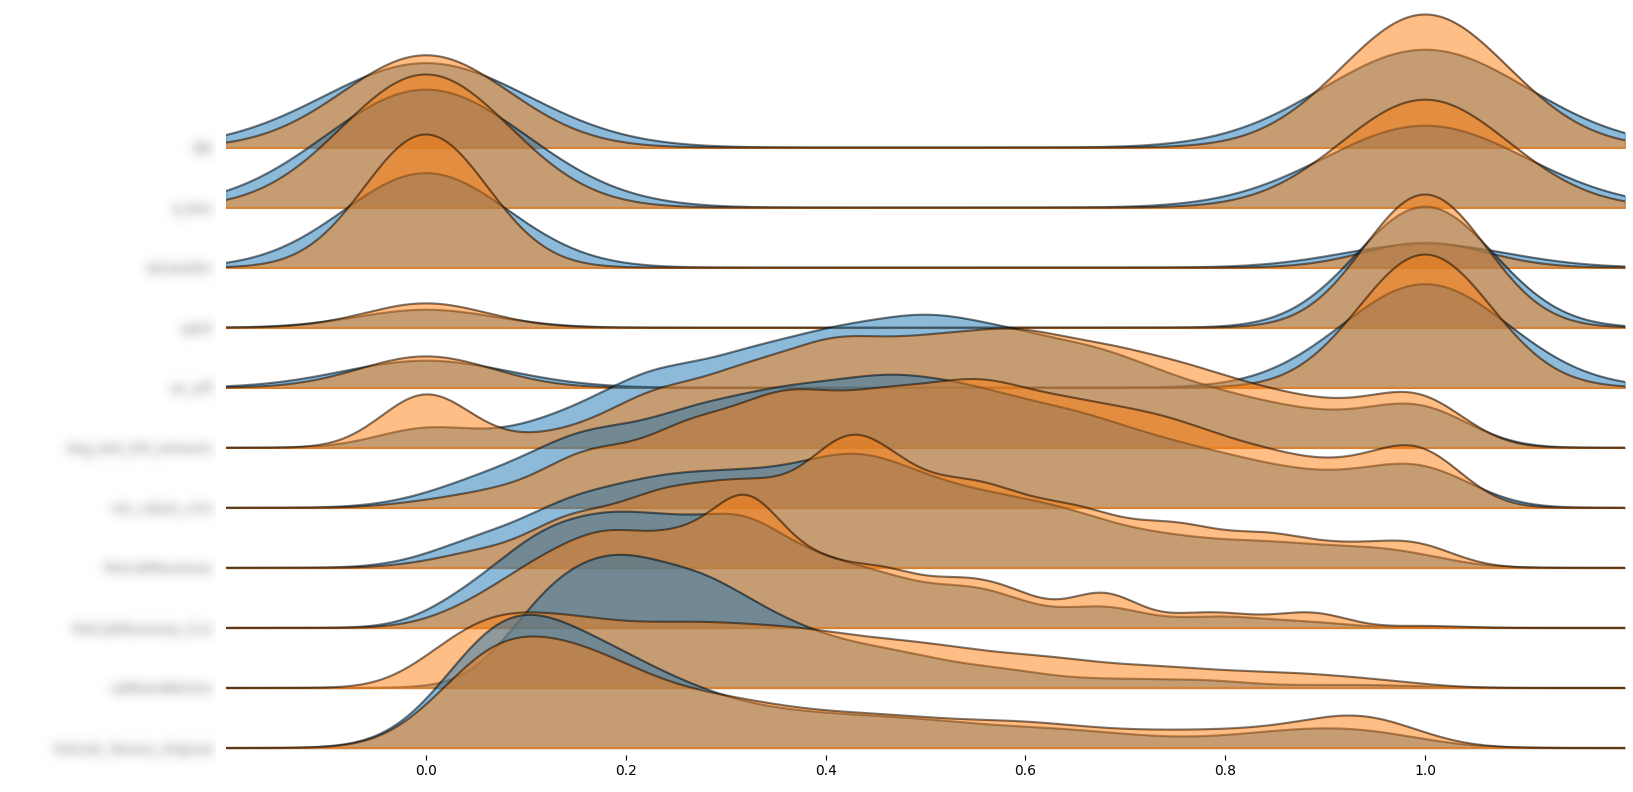 Overlay distribution of features: joyplot
We build a predictive model for the on-call metric
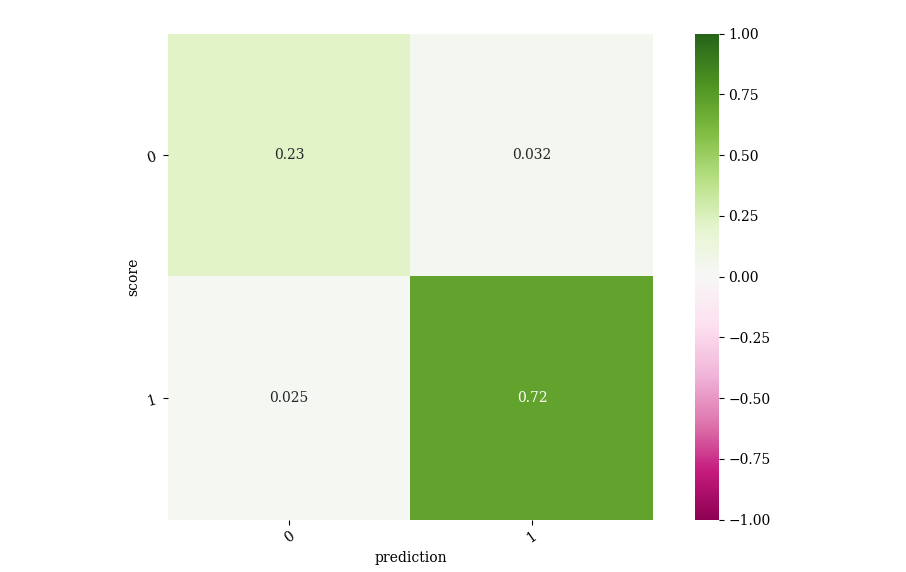 confusion matrix on prediction:
on-call
We use the prediction of the previous model to predict the new metric
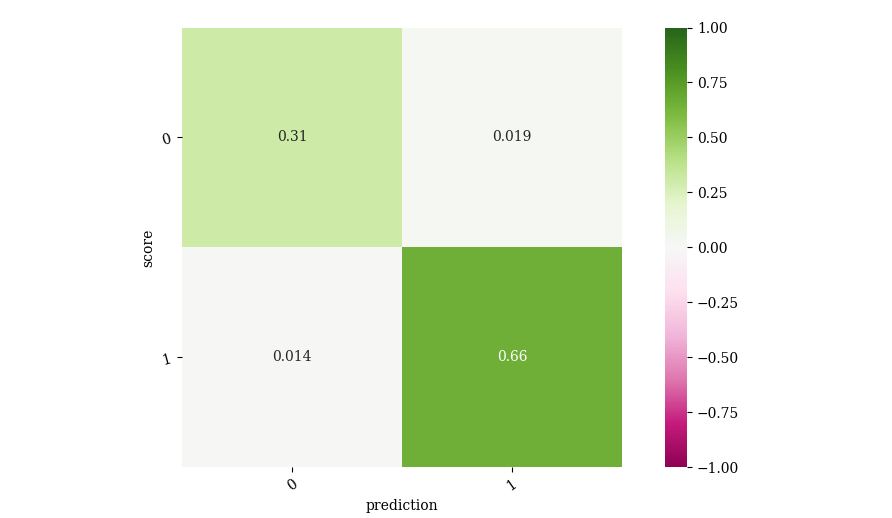 confusion matrix on prediction:
lagged
We knock-out features to calculate the relative importance of that feature
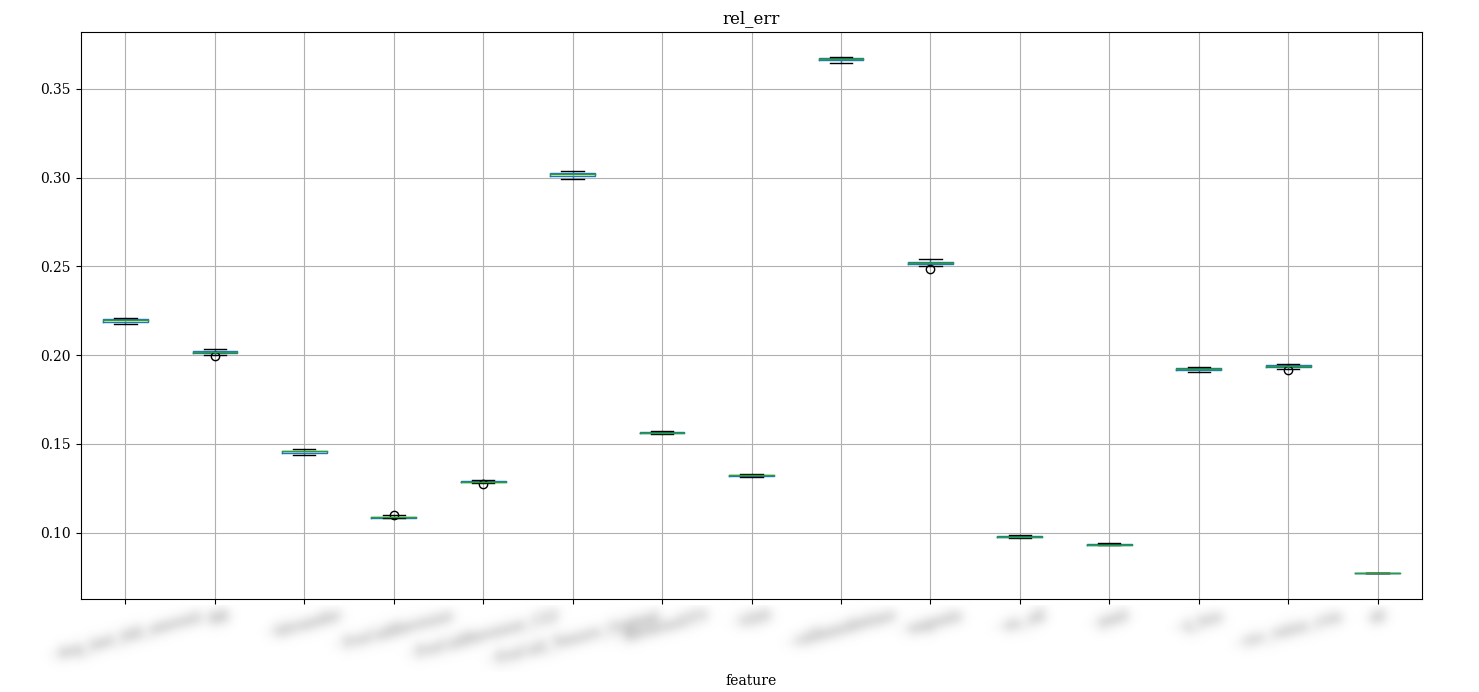 knock-out of features from trained model:
on-call
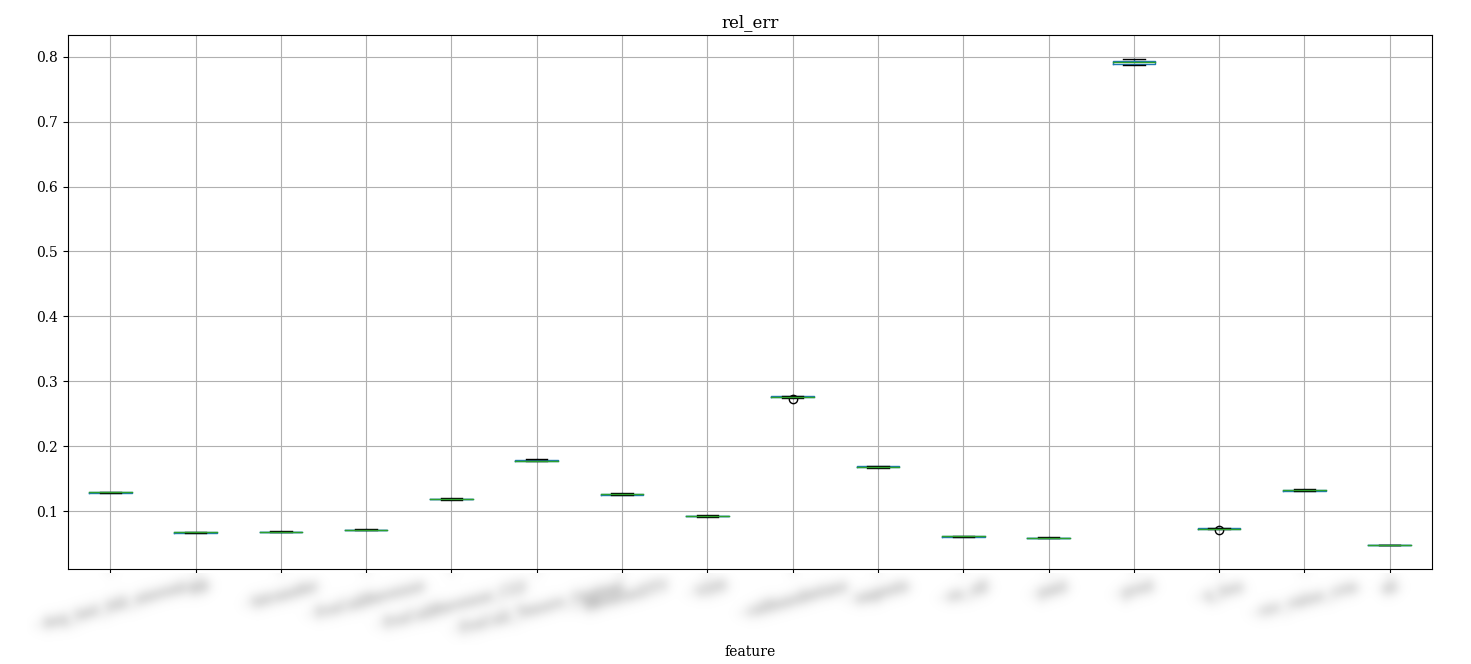 knock-out of features from trained
model: lagged
We finally check the relative difference between on-call and lagged
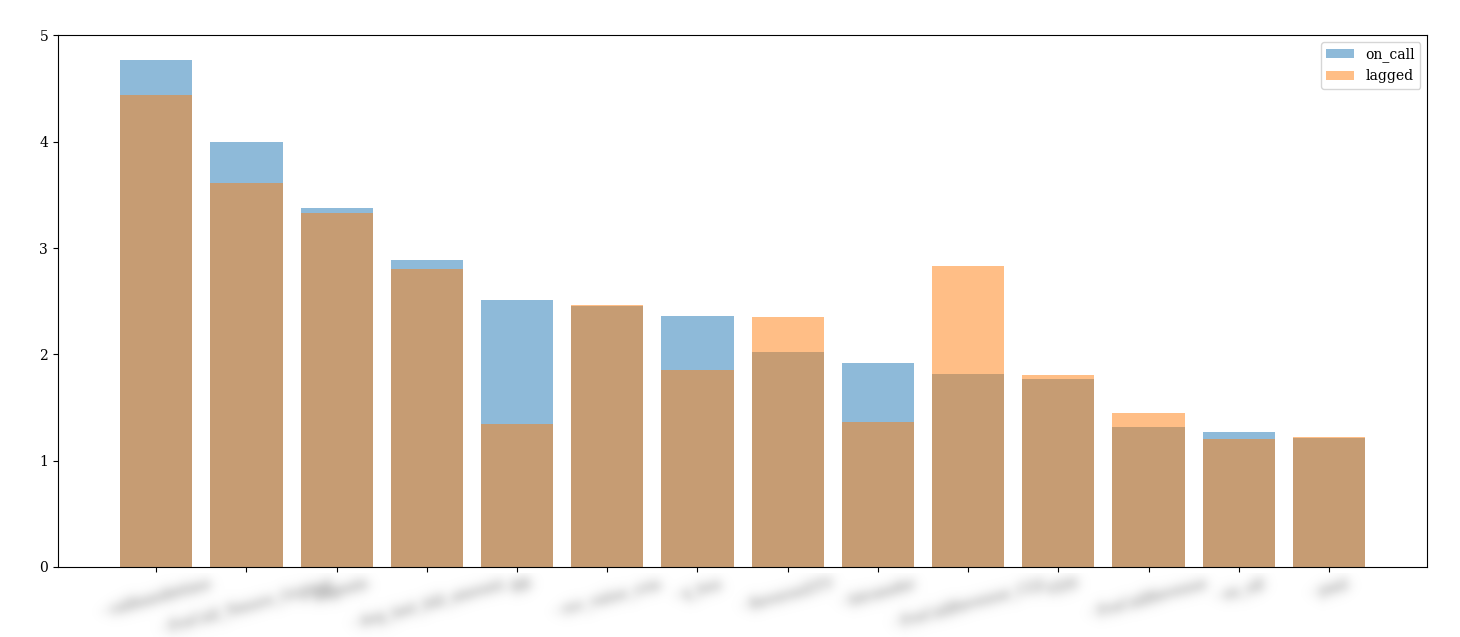 relative difference between feature
importance in lagged metrics
We can study the relative feature importance
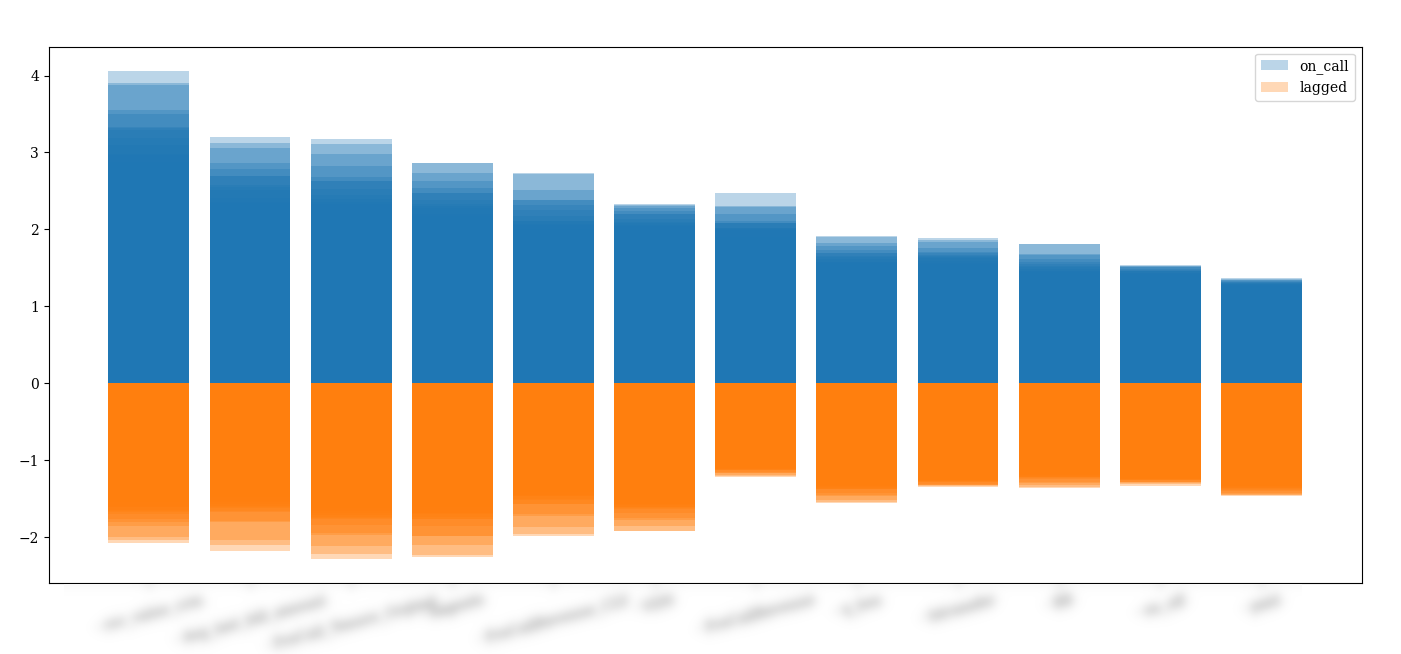 feature importance (week overlay)
and see how it evolves week by week
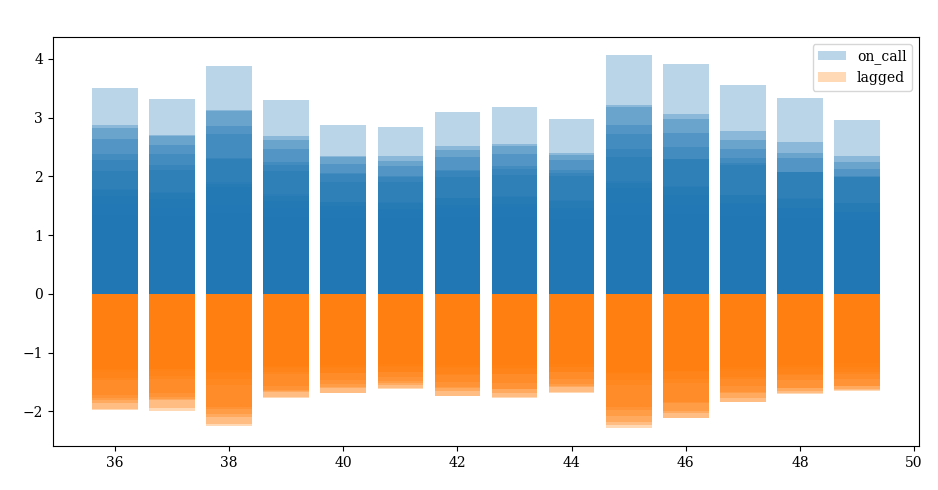 relative importance week by week
We study over week how the relative importance of that metric dropw over time
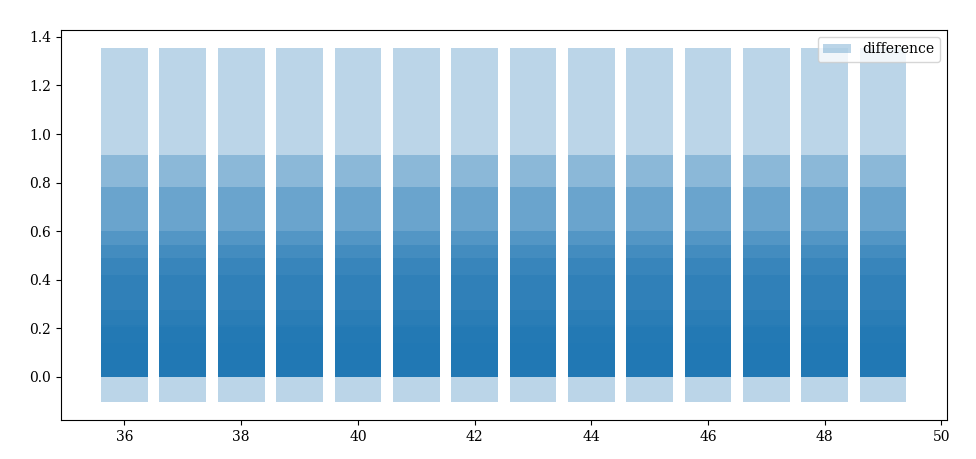 importance difference relative to lagged
metrics
We calculate the lift depending on categorical metrics
lift = SRon − SRoff
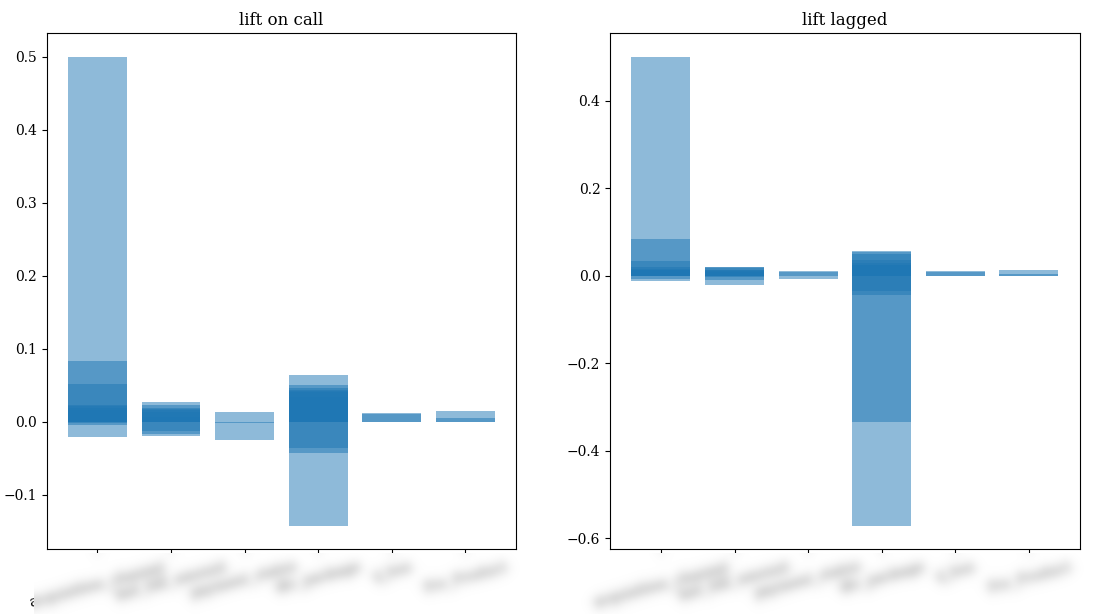 lift relative to categorical metrics
We look month per month how the association of agents per area varies over time
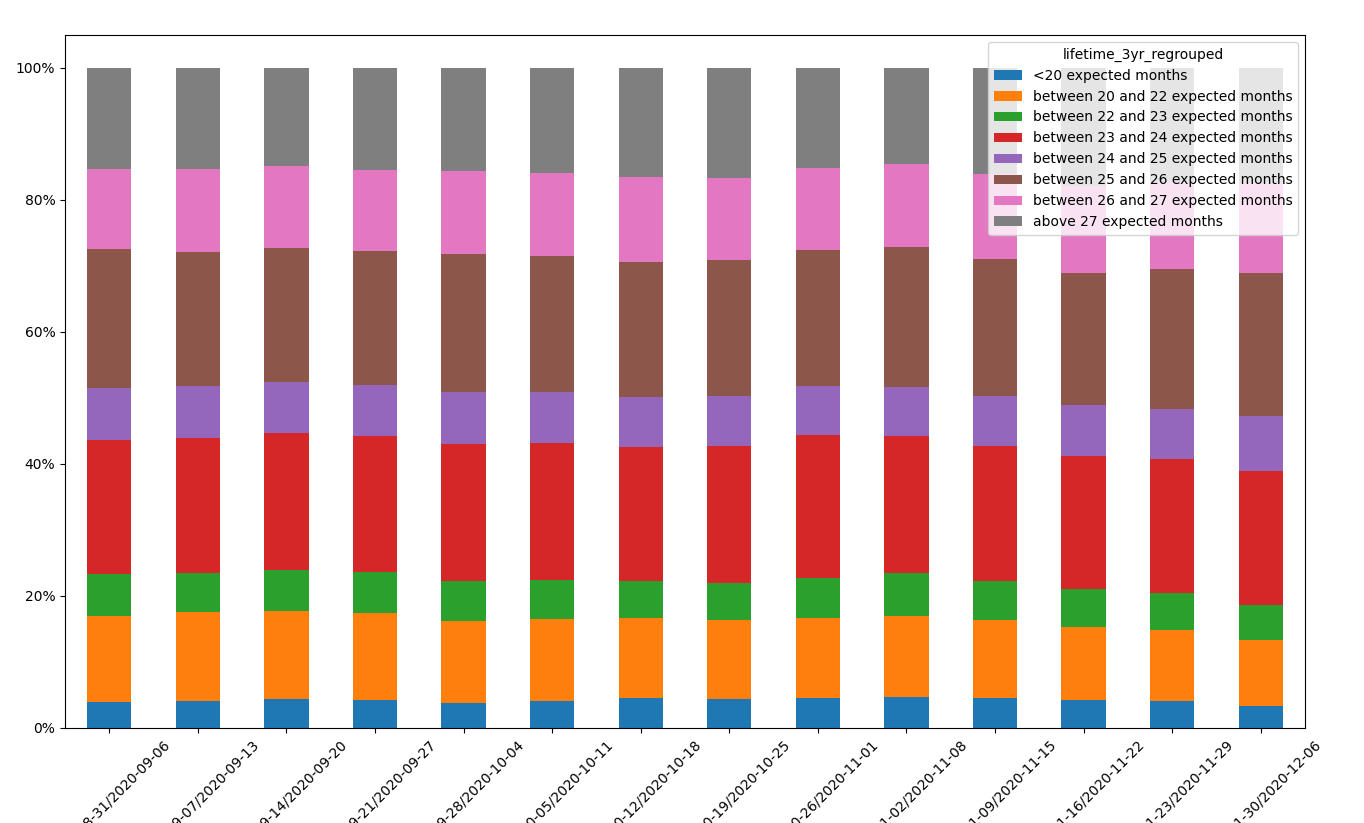 time series volume changes in
cohorts
Shuffling among cohorts
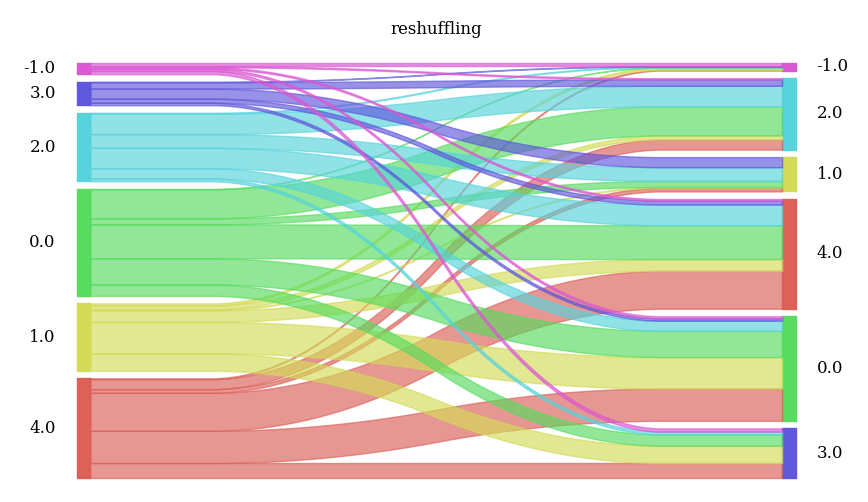 reshuffling of agents cohorts
