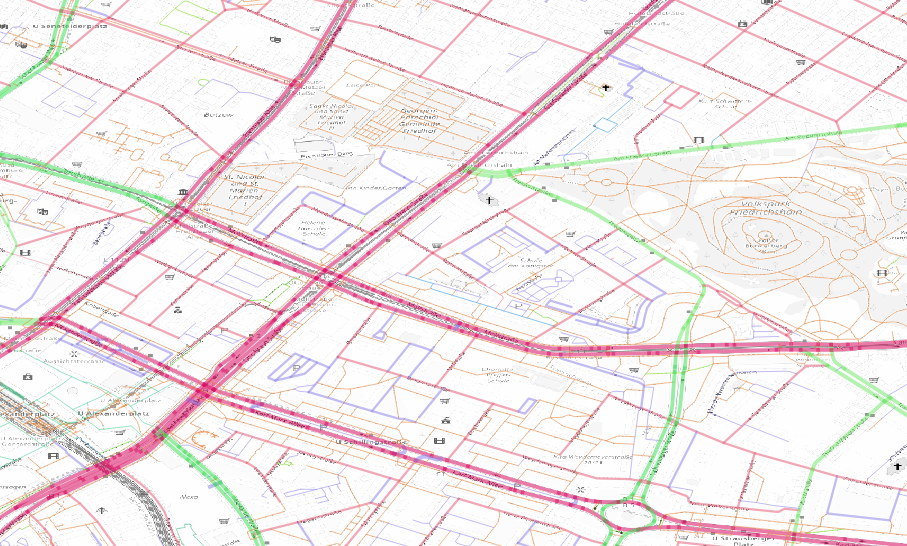
We can download the street network from openstreetmap and the information are pretty detailed

detail of a graph
We see a lot of different street types, depending on the mean of transportation we need to run some operation on the graph and reduce the number of edges keeping the correct distances.
depending on the mean of transportation we select only particular street classes

different kind of graphs depending on the mean of transportation
We build a graph from the geo dataframe
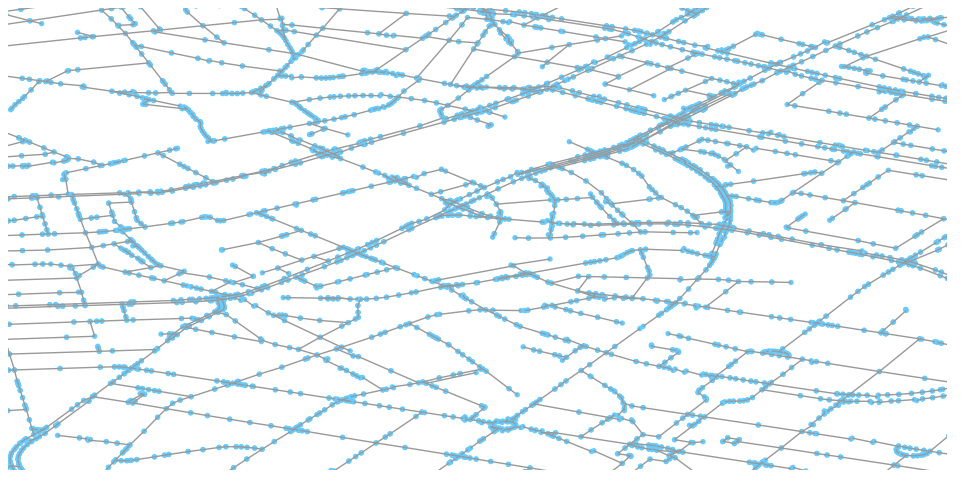
detail of a graph
We label the nodes with geohash and depending on the digit used we have different number of nodes and connectivity
| digit | node | link |
|---|---|---|
| 9 | 10k | 22k |
| 10 | 24k | 29k |
| 13 | 35k | 32k |
With low digit we complete distort the geometry, with high number of digits we lose connectivity

disconnected graph
We realize that some parts are disconnected and therefore we take the largest connected graph
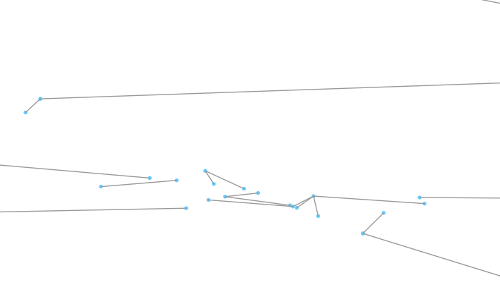
disconnected graph
We weight taking in consideration speed, street class, and length. We apply a factor for each street type
| highway | factor |
|---|---|
| motorway | 3 |
| primary | 2 |
| secondary | 2 |
| tertiary | 1.5 |
| residential | 0.5 |
We can than weight a graph with this simple formula:
$$ \frac{speed * type}{length} $$
and obtain a weighted graph
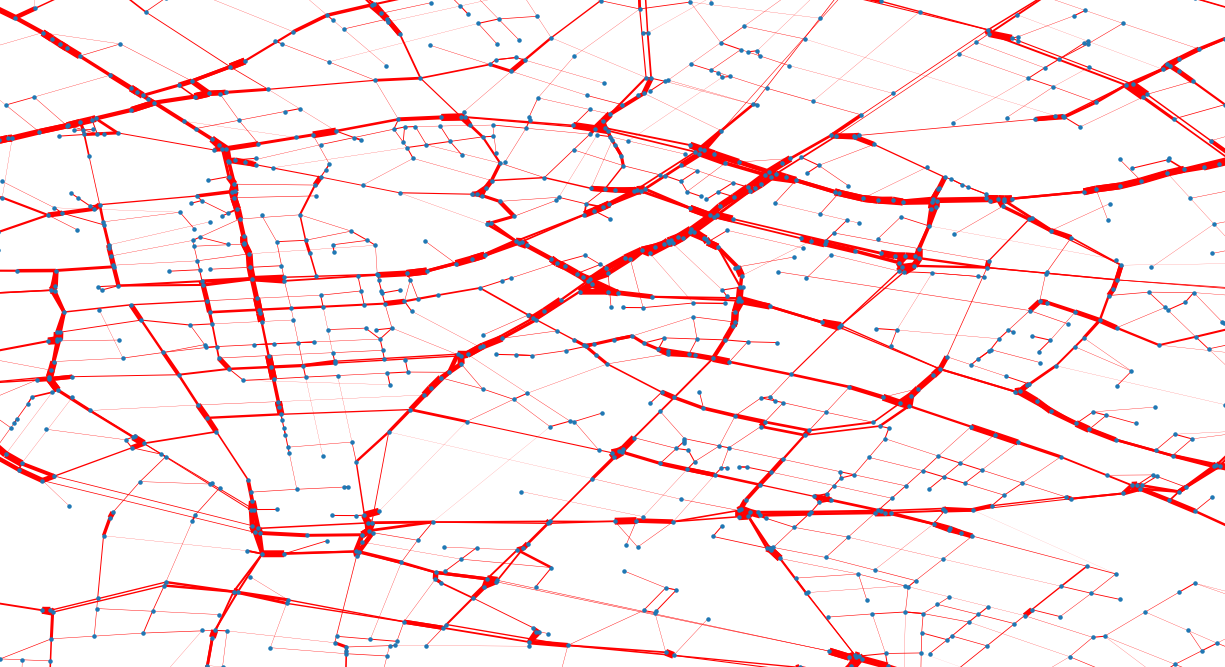
different weighting per street
We selected the closest node per each spot
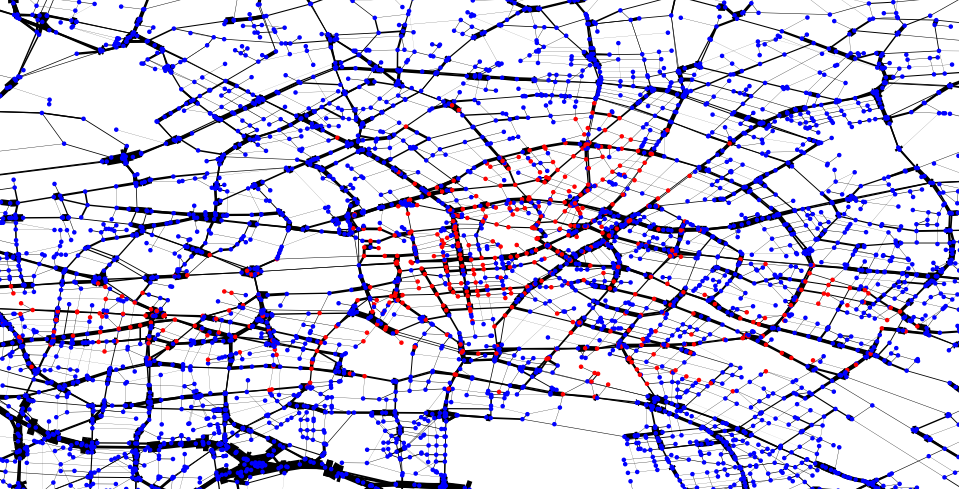
closest node per spot (in red)
The first iterations show not logical routes which is mainly due to the direct nature of the graph

shortest path between two spots in a directed graph
A good directed graph is a lot of work and we by now use a undirected graph for reasonable routes

shortest path between two spots in a directed graph
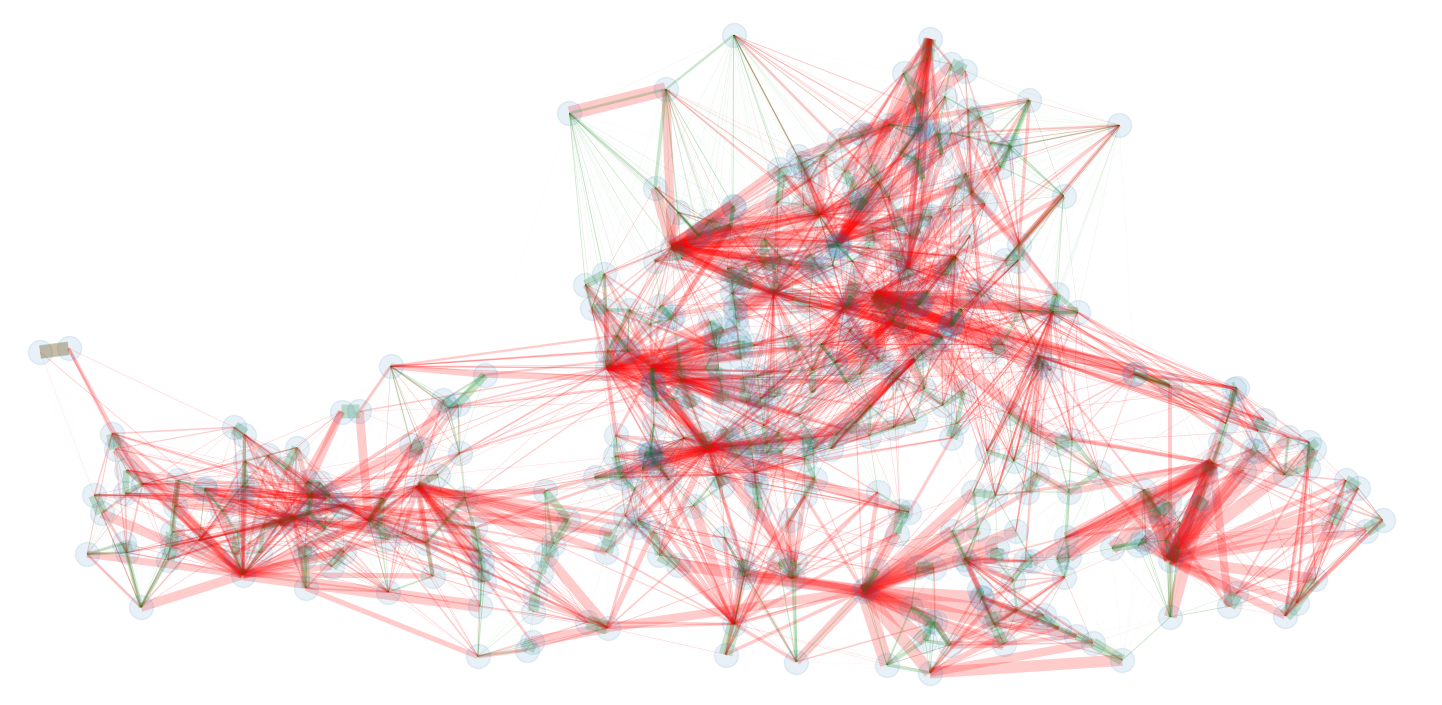
changes in the Markov graph moving to weights
We compare different graphs
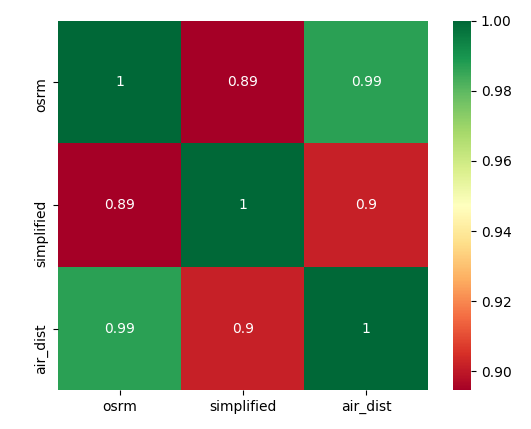
asymmetry matrix
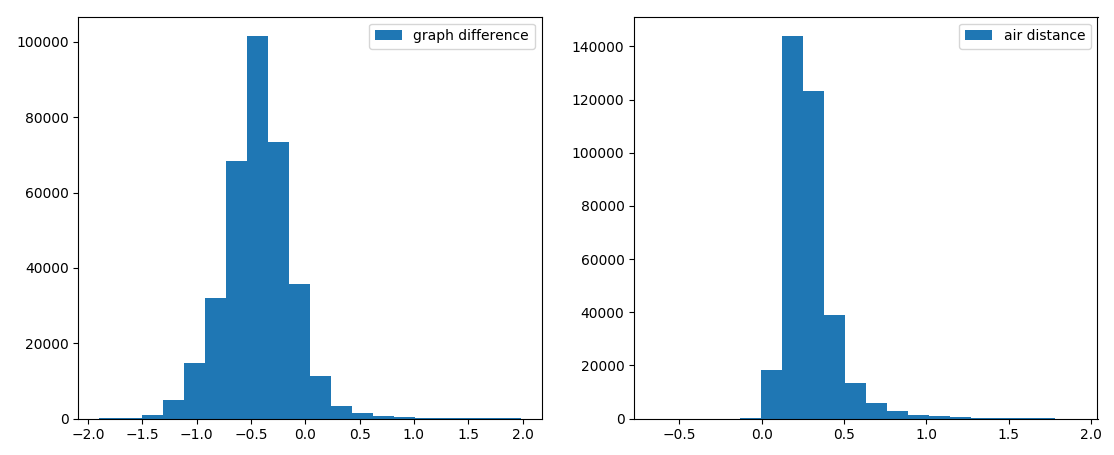
asymmetry distribution
