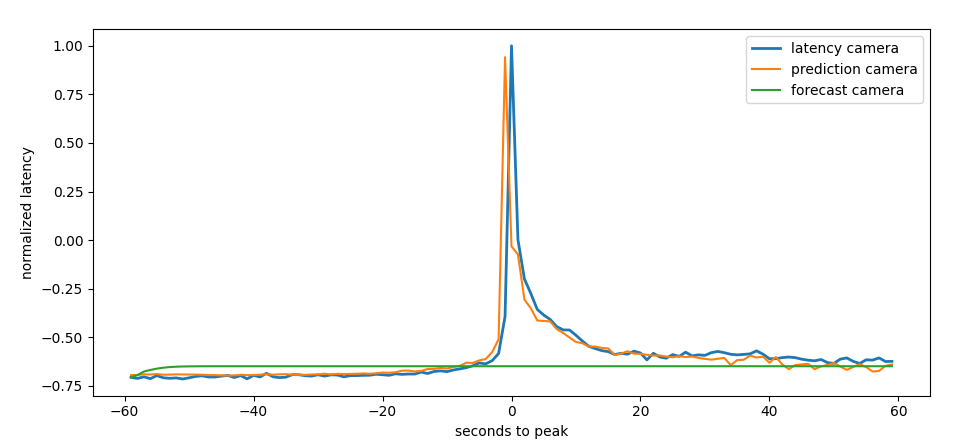
 difference between prediction and
forecast
difference between prediction and
forecastCode: forecast_spike.
To forecast a spike we start first with a good prediction
 difference between prediction and
forecast
We see that the training process runs smoothly 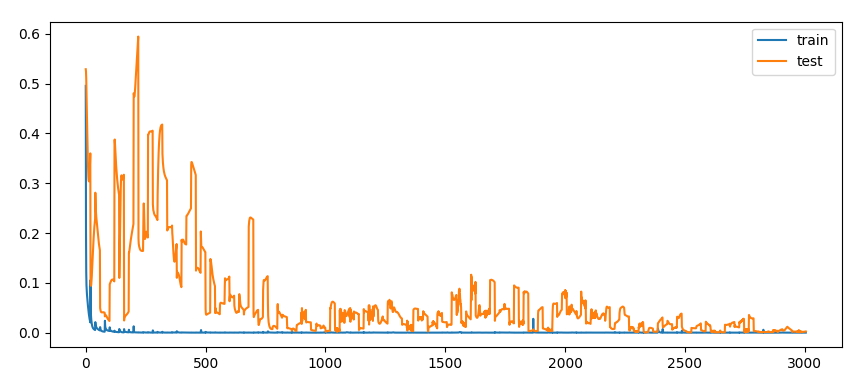 traning history
To train the model we proceed in the following way:
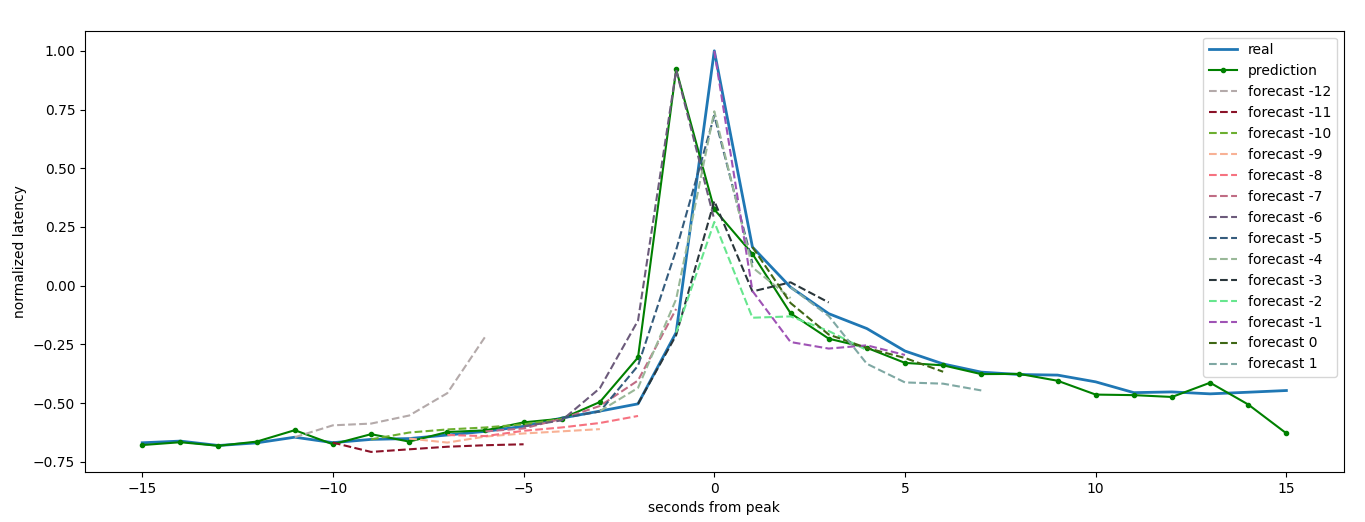
Than we roll different spike advance times until the spike is forecasted
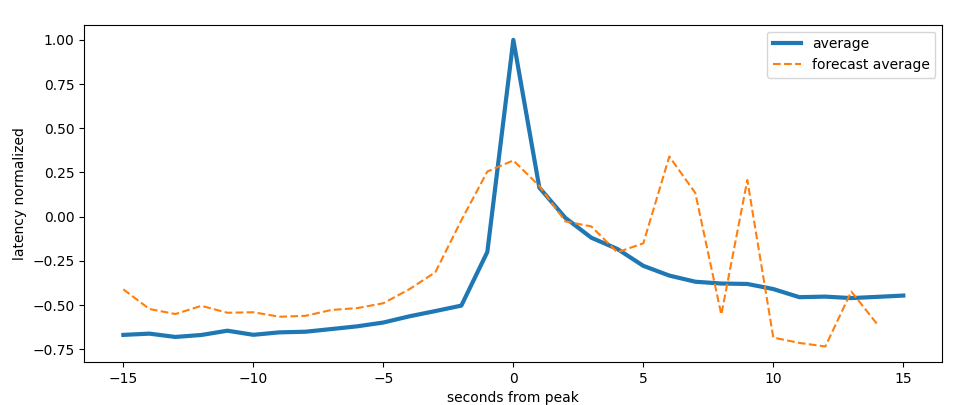 forecast advance effectivity
We can see that around -0.5 seconds the spike is forecasted correctly
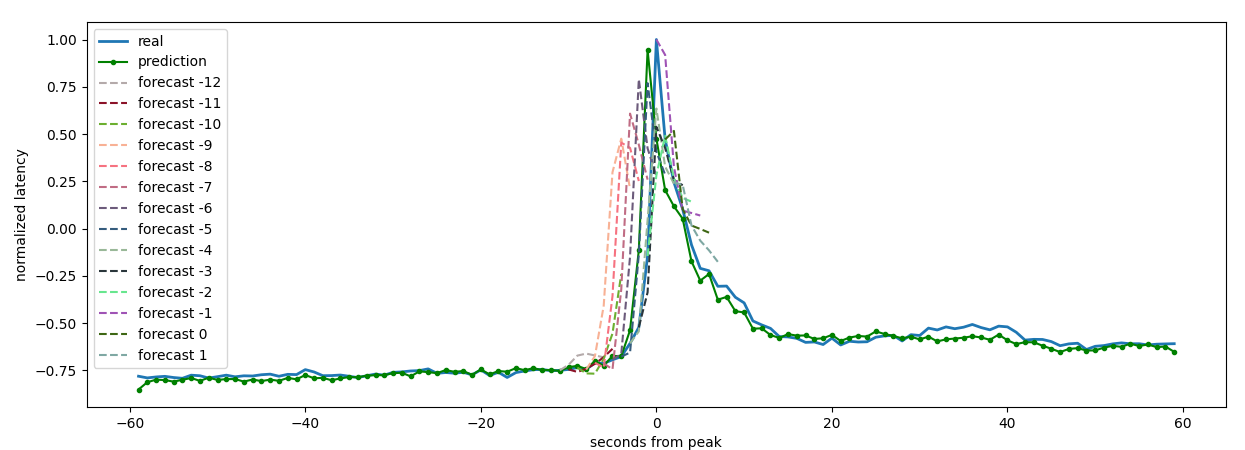
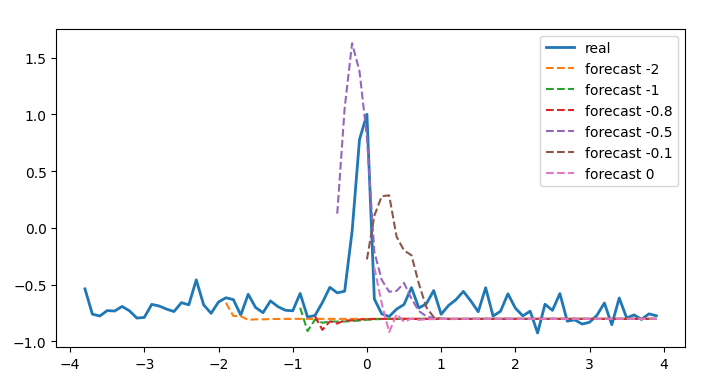 forecast prior to the spike
To speed up a bit the exploration we analyze the sec pace series. We see that the forecast for the denoised series is pretty accurate
 rolling forecast on the next 6
seconds
In some cases forecast results are different for neighboring starting points
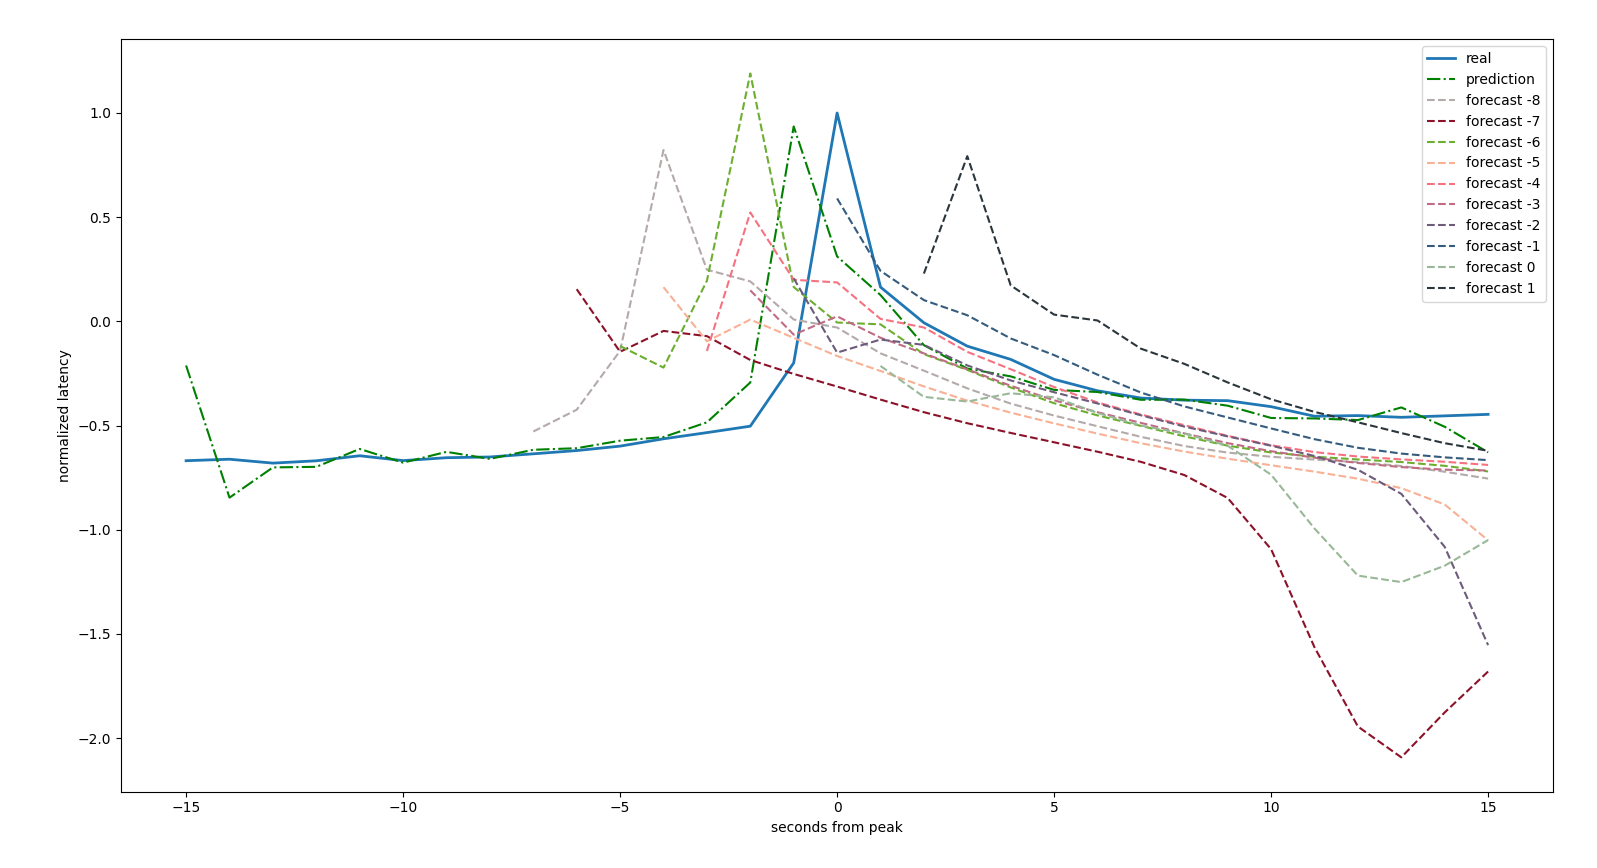 rolling forecast on the next 6
seconds
Some models are really accurate on the denoised series
 rolling forecast on the next 6
seconds
We see that in some cases we have false positive
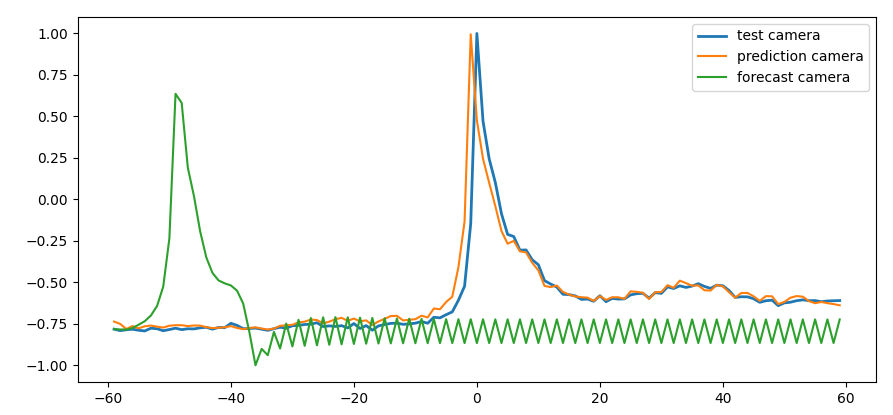 false positive, a spike is forecasted where there is none
If we analyze the maximum of the peak forecast we see that some models can forecast 3 seconds in advance
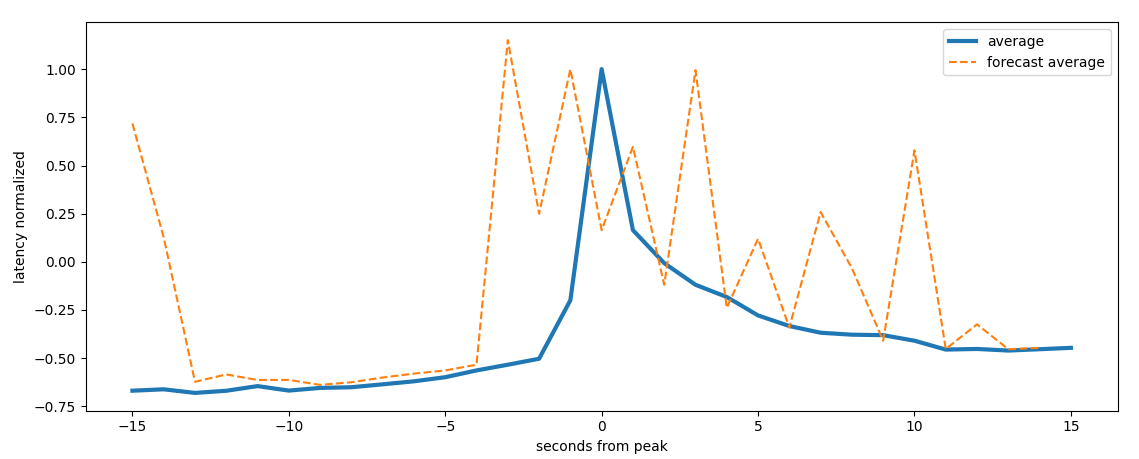 maximum forecast on a rolling windows of 12 seconds
Using modem features we can have an earlier estimation
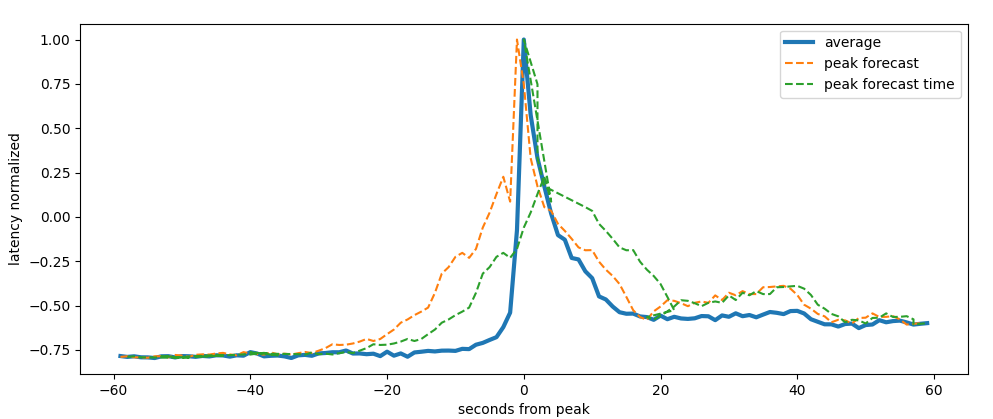 latency maximum forecast on a 6 seconds, modem features
We iterate over every single series and forecast from every single
from_peak value and compute the maximum of the forecasted
latency
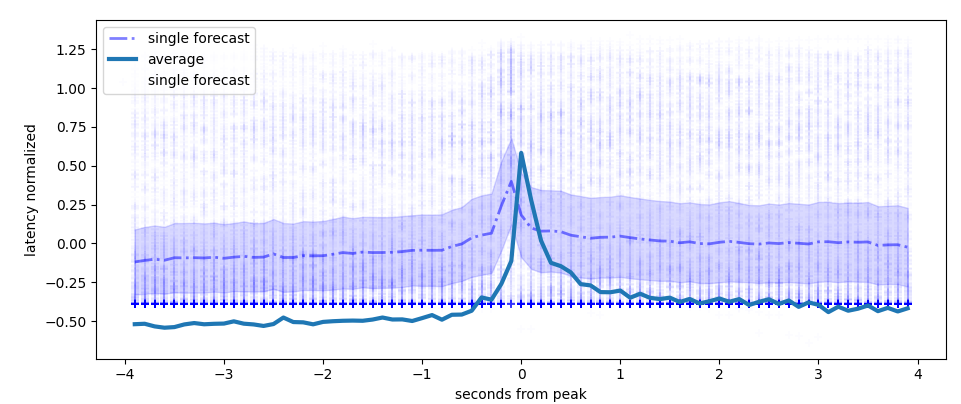 maximum latency forecast per series, deci seconds
We than calculate the forecast curves per series and per starting point and calculate the maximum for each curve. For some models the forecast returns many false positives
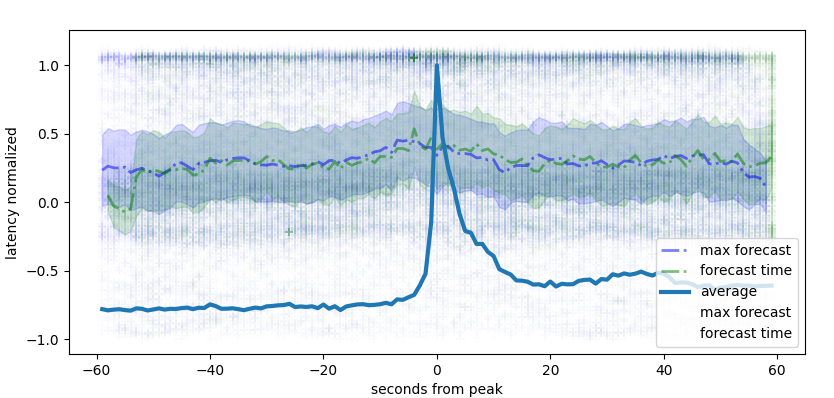 maximum forecast on a rolling windows of 6 seconds
Using modem features we can forecast earlier on average
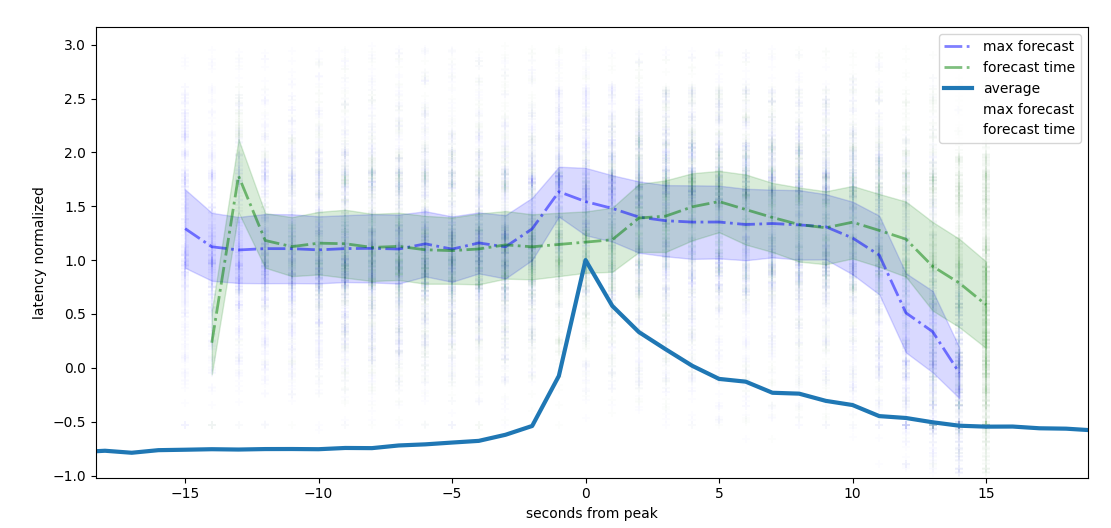 latency maximum forecast on modem features, single series
We than calculate the maximum latency per series per
time_to_peak, we identify a peak setting a threshold
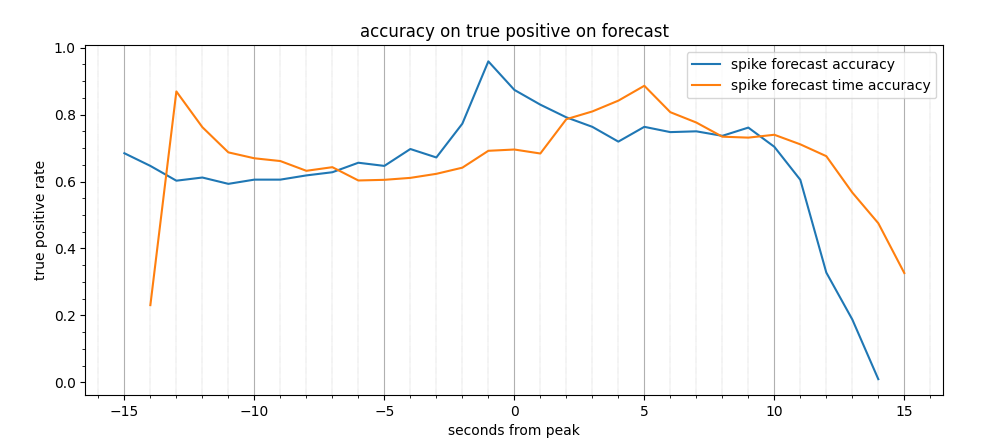 true positive rate, modem features
We show the tradeoff using different type of thresholds
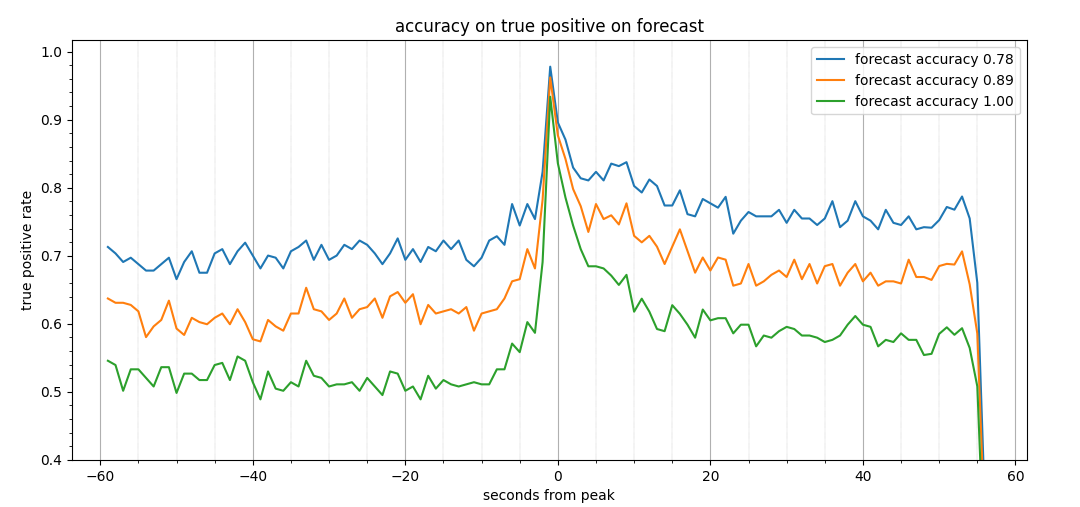 true positive rate, dependence on threshold
Now we take the derivative of the signal
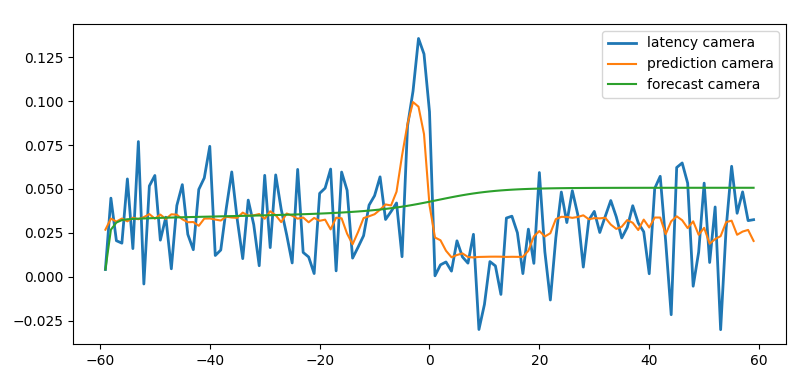 derivative of camera latency
And we train a model on the with all features derived
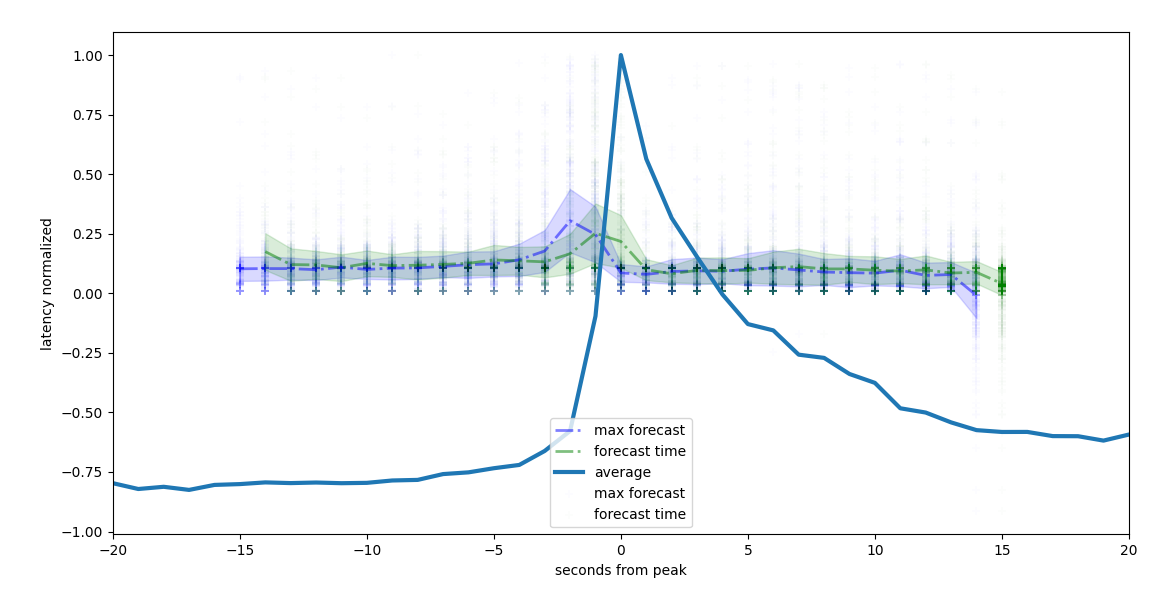 latency forecast on single series and starting point
We than calculate the accuracy depending on the threshold
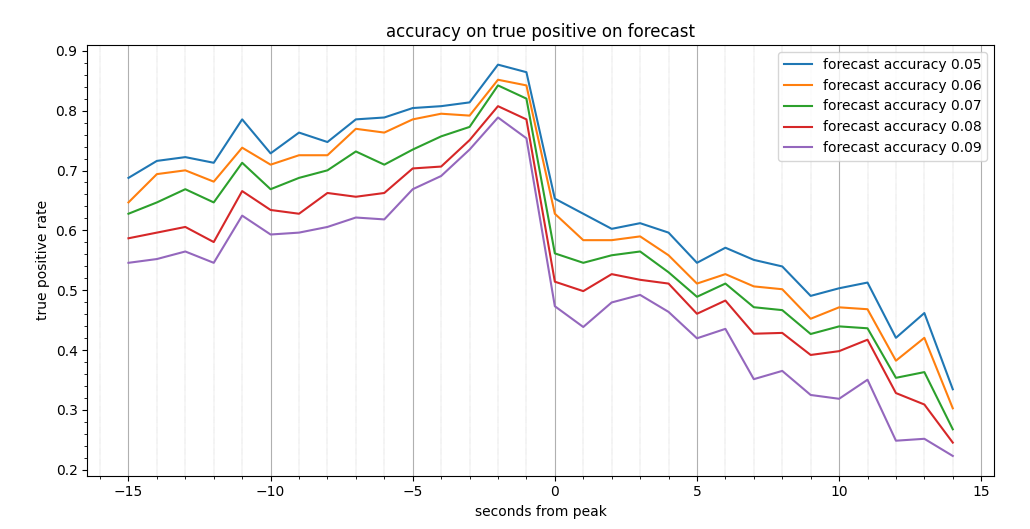 accuracy of forecast depending on the threshold
We see that substantiall changing the size of the window doesn’t change much the results
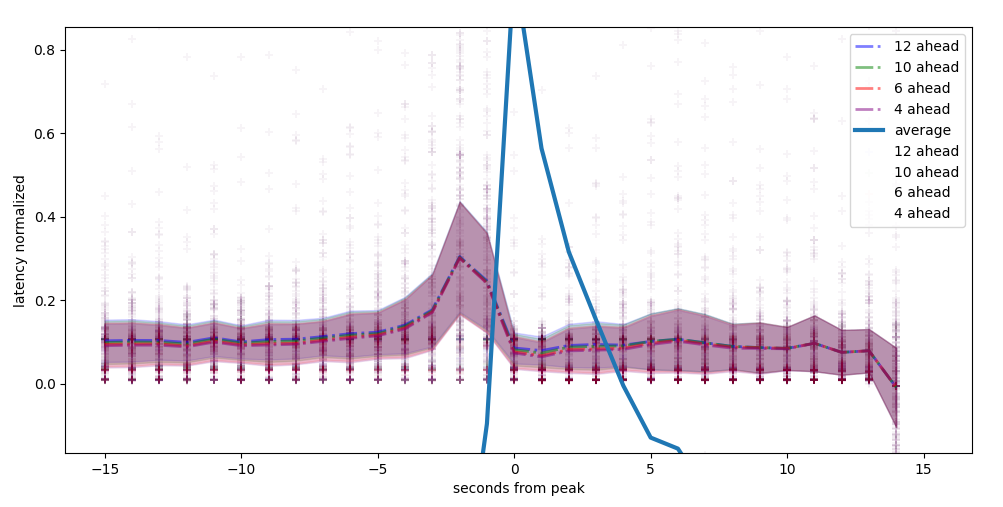 forecast on different rolling windows
We now use a double history points to forecast the next point
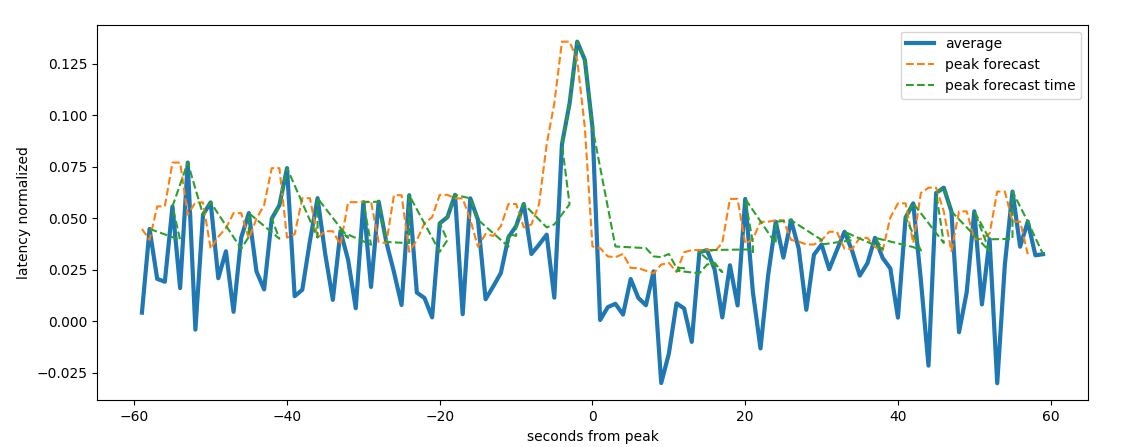 forecast on double history
Forecast on single series and rolling windos
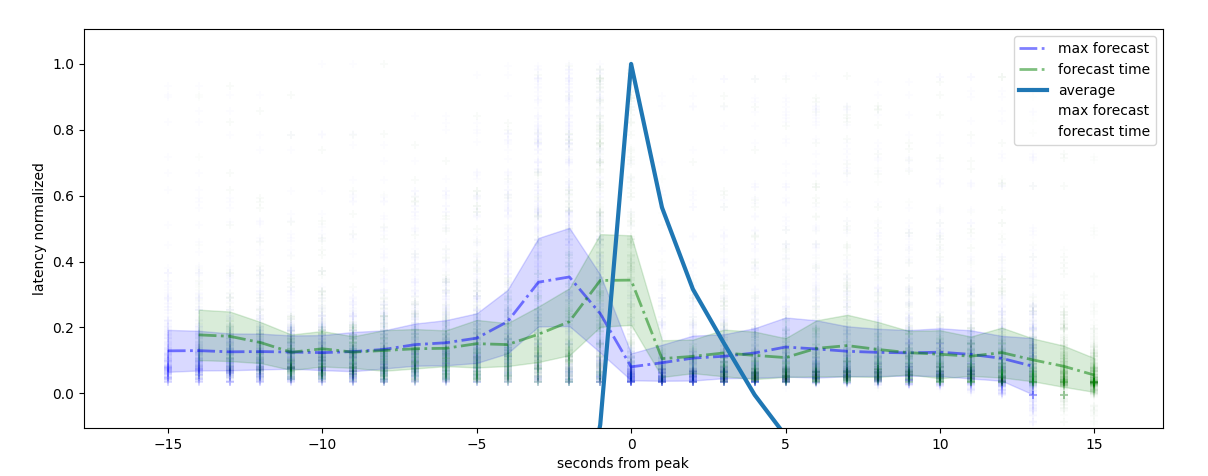 double forecast series
Accuracy on single series forecast
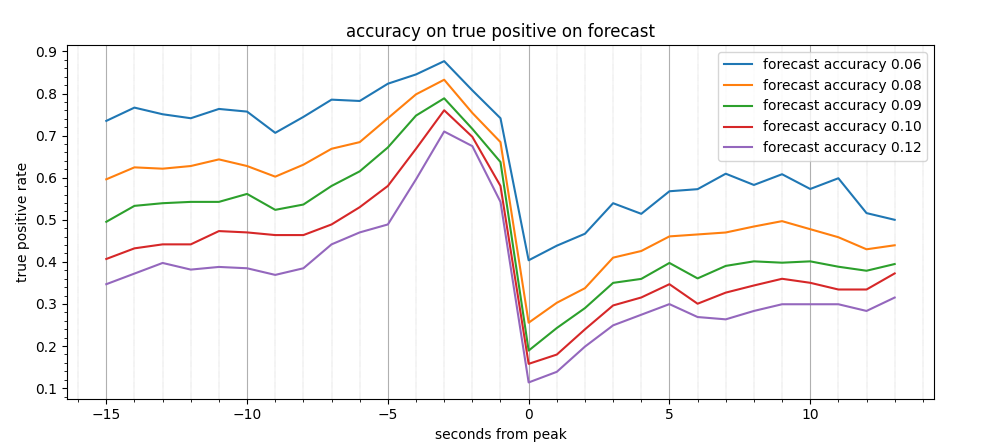 double forecast accuracy
Feature importance by substituing the feature by random values
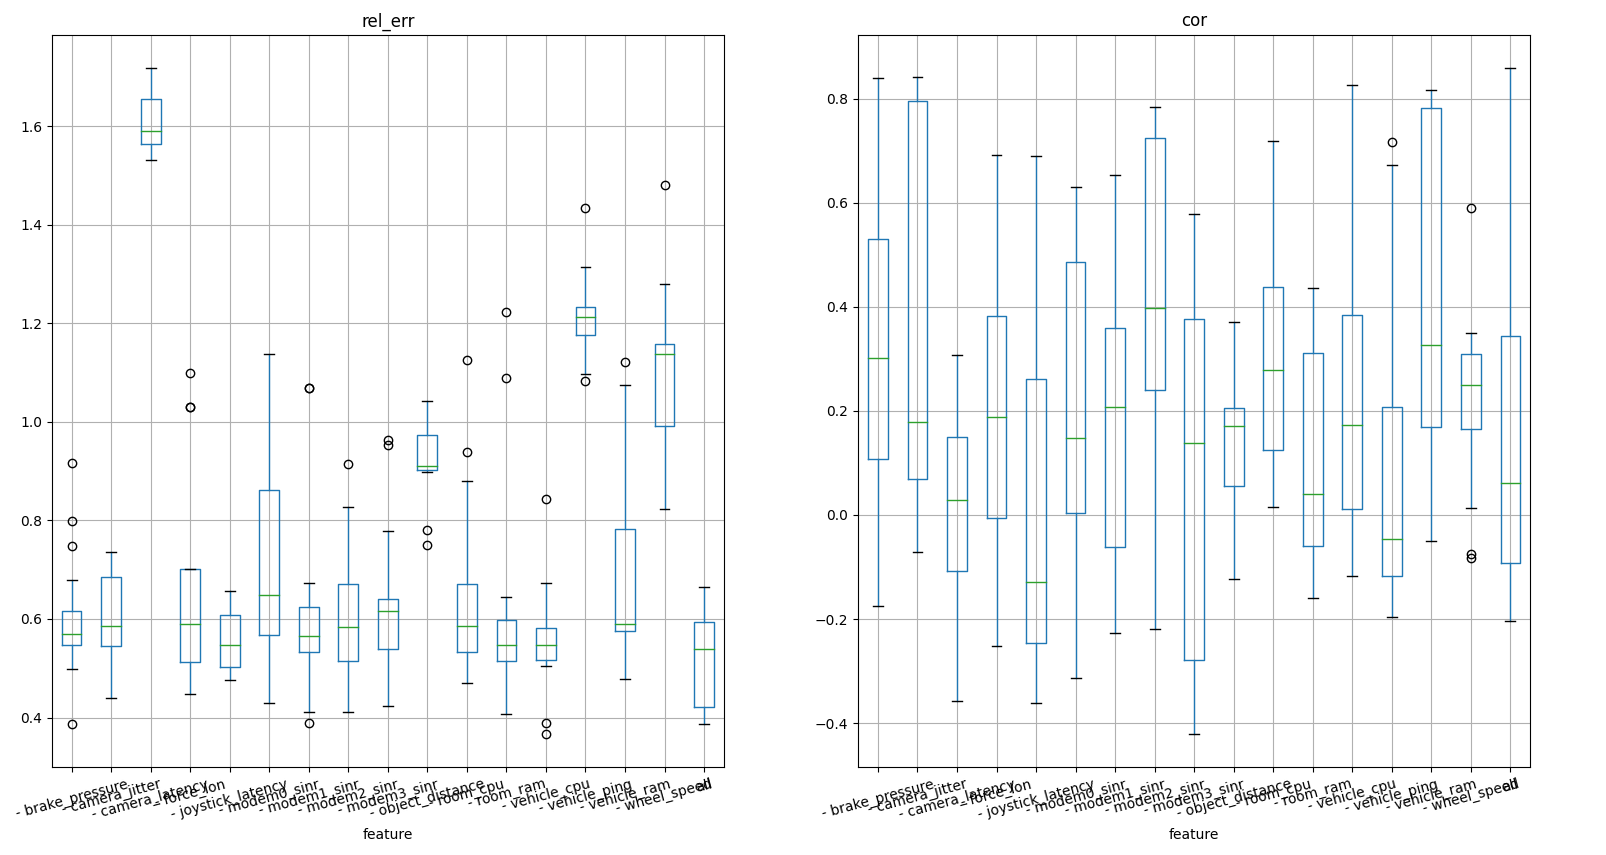 difference knock out
For the validation we take calendar week 39 and we perform a pre trained model. We check that the model deliver reliable forecasts on a time window of 6 seconds
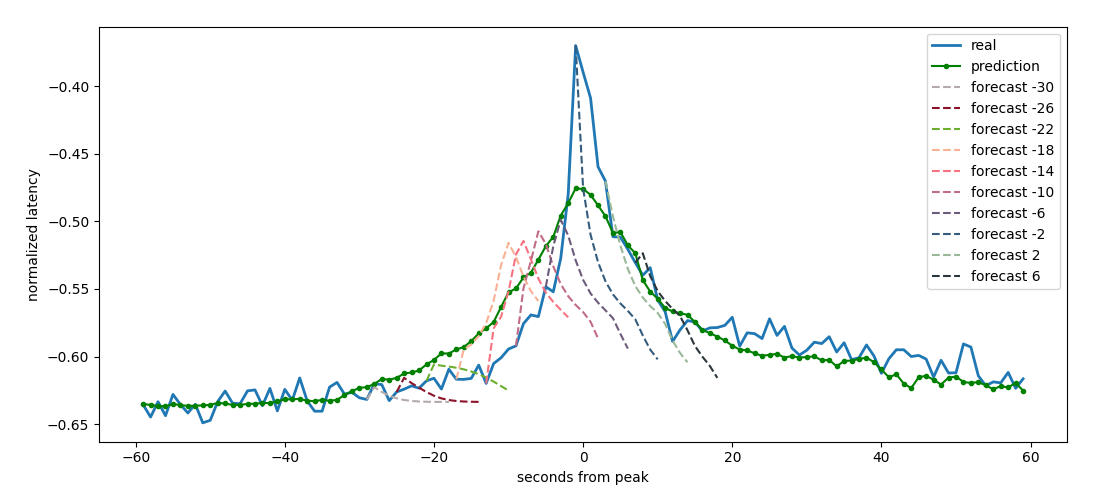 forecast on a rolling window of 6 seconds on a denoised
series
were we used the simple non derivative single step model for sake of speed. We take the maximum of each forecast and build the forecast line
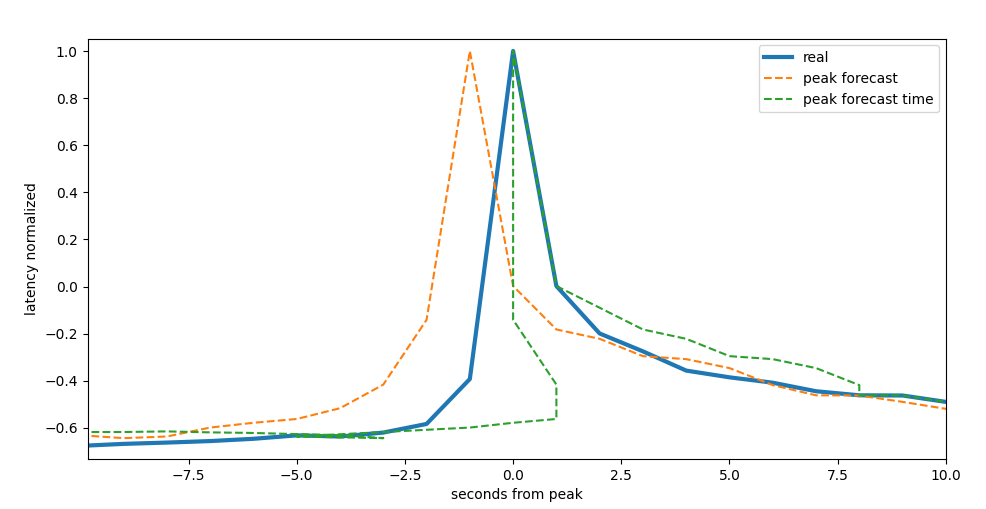 maximum forecast on the rolling
window
We than perform a forecast for each second of the week and compare its maximum with the signal maximum on a rolling window of 1, 6, 12 and 30 seconds
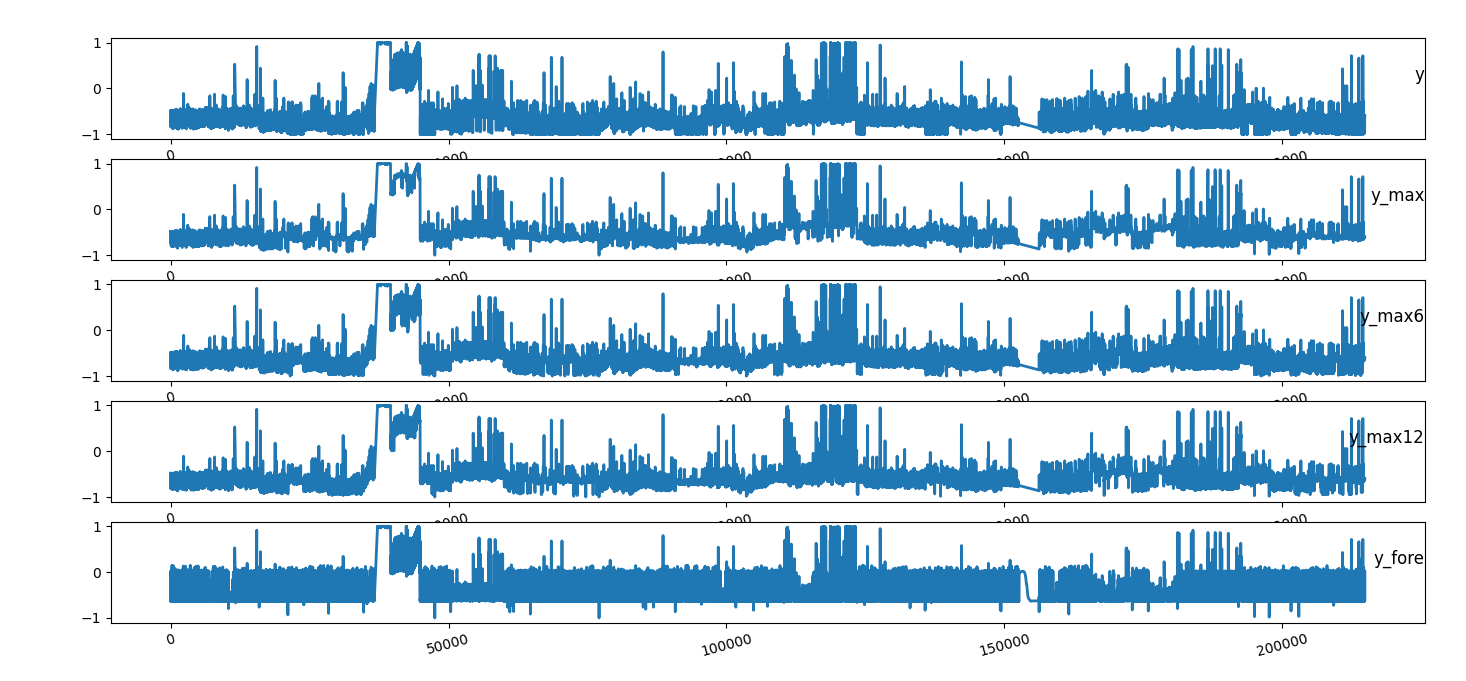 time series of camera latency considering
the maximum of the next
 n steps
We than set a threshold and we count how many data points are above this threshod (spike) in a time bin of 4 seconds
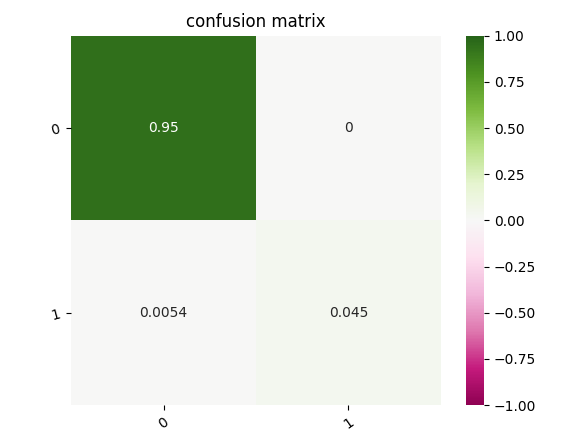 confusion matrix about the presence of spikes in the next 4
seconds
and compute the same for the next 30 seconds
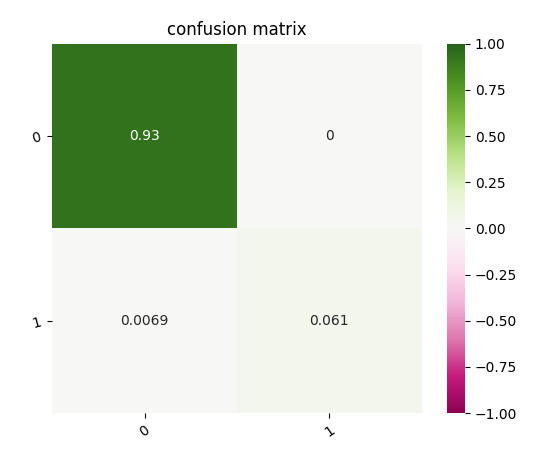 confusion matrix about the presence of spikes in the next 30
seconds
We see that the false negative rate is around 0.5% and that the model is pretty conservative since there are no false positive. That means that around 10% of the spikes are still undiscovered.
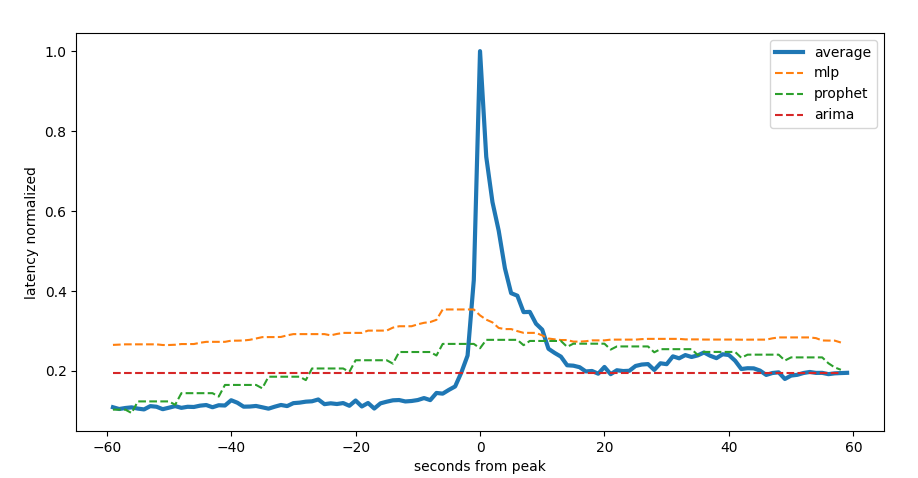
We started performing some naive forecasting on the time series and we compare the results of facebook prophet, a multi layer perceptron regressor and a arima. The first two models take into consideration the sensor features too.
We see that the peaks are really abrupt and the naive models can’t forecast it.
 first peak
