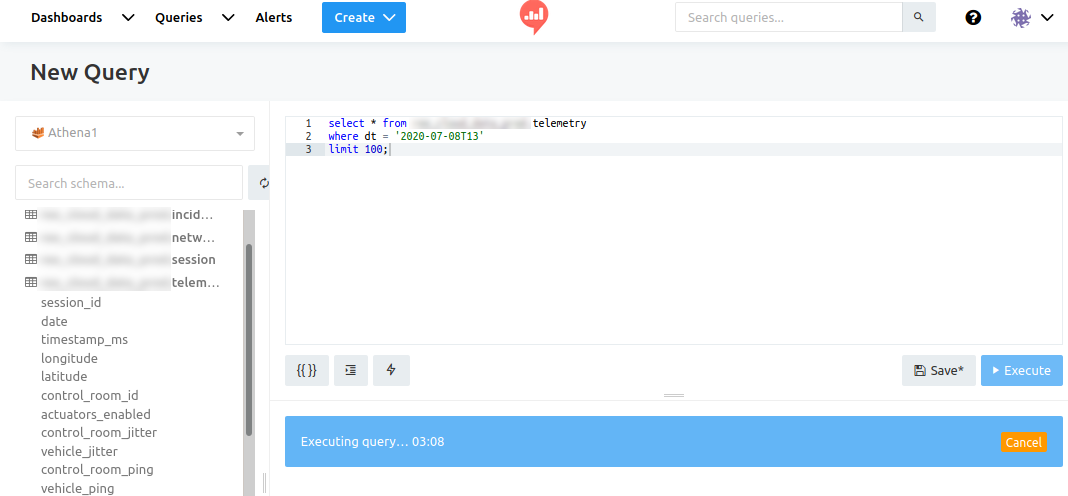
 redash query on telemetry table
Report on the data quality of the features
Code: etl_feature.
Data are stored in Athena.
 redash query on telemetry table
We have 4 relevant tables
['telemetry','network_log','session','incident'] which log
all relevant events connected to the drive. Tables are partioned down to
the single hour and vehicle.
We have 3 environments ['prod','stg','dev'] where only
in prod data are complete.
Telemetry contains the most useful information, most of the sensor data concerning vehicle dynamics and board usage. Data are ingested in an unregular way, every sensor calls the backend with different timing. Each 200ms we see a main ingestion of 2 to 5 sensors around 30ms. Information is scattered and uncomplete.
 telemetry table, on record per topic
We call the
['mean_km_per_hour', 'lateral_force_m_per_sec_squared','longitudinal_force_m_per_sec_squared']
the sensor_features and the
['v_cpu_usage_percent', 'v_ram_usage_percent' the
board features and the
['e2e_latency', 'camera_latency', 'joystick_latency'] the
predictions.
We have different sources populating the telemetry
table, some coming from the vehicle, others from the
control_room. Data are collected and ingested with a
different pace and sent to the backend and follow this a protobuffer
schema.
 telemetry meta information
Each ROS topic collects the data at a different publishing rate, data are punctual and not averaged on the device. Some data don’t get sent or they don’t get collected, additional logs are stored on the vehicle but not sent to the backend.
Each topic has a publisher and a subscriber, the publisher set the timestamp and sends data over the network.
At first we see that data ingestion pretty irregular.
We than group the different sources based on their firing behaviour
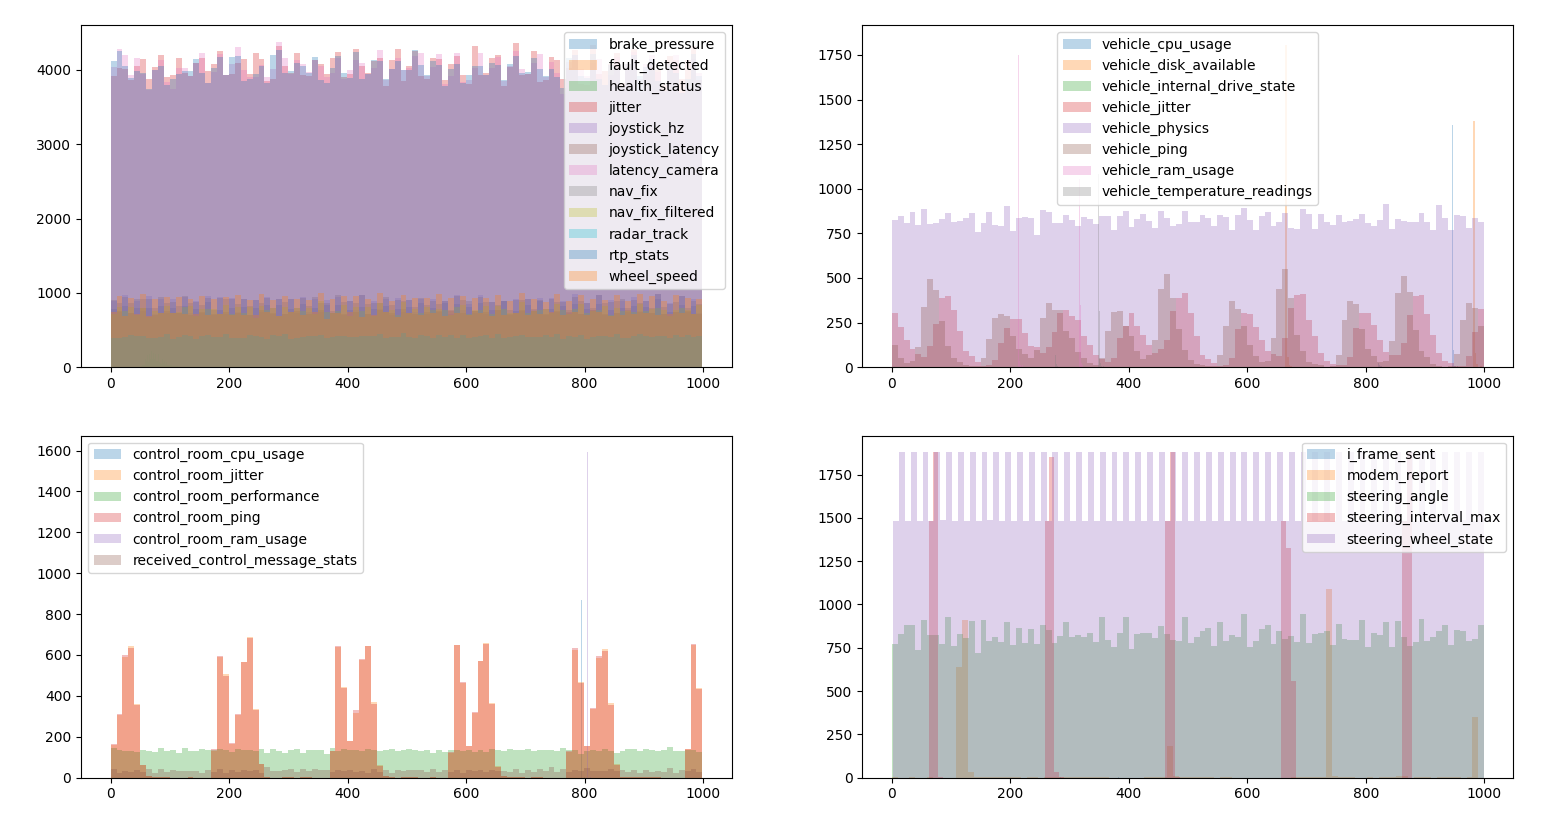 grouping
sources per frequency range
We see that even within the same source group we have diffente firing behaviour and syncing the different sources is not trivial.
We create a heatmap to visualize the firing behaviour
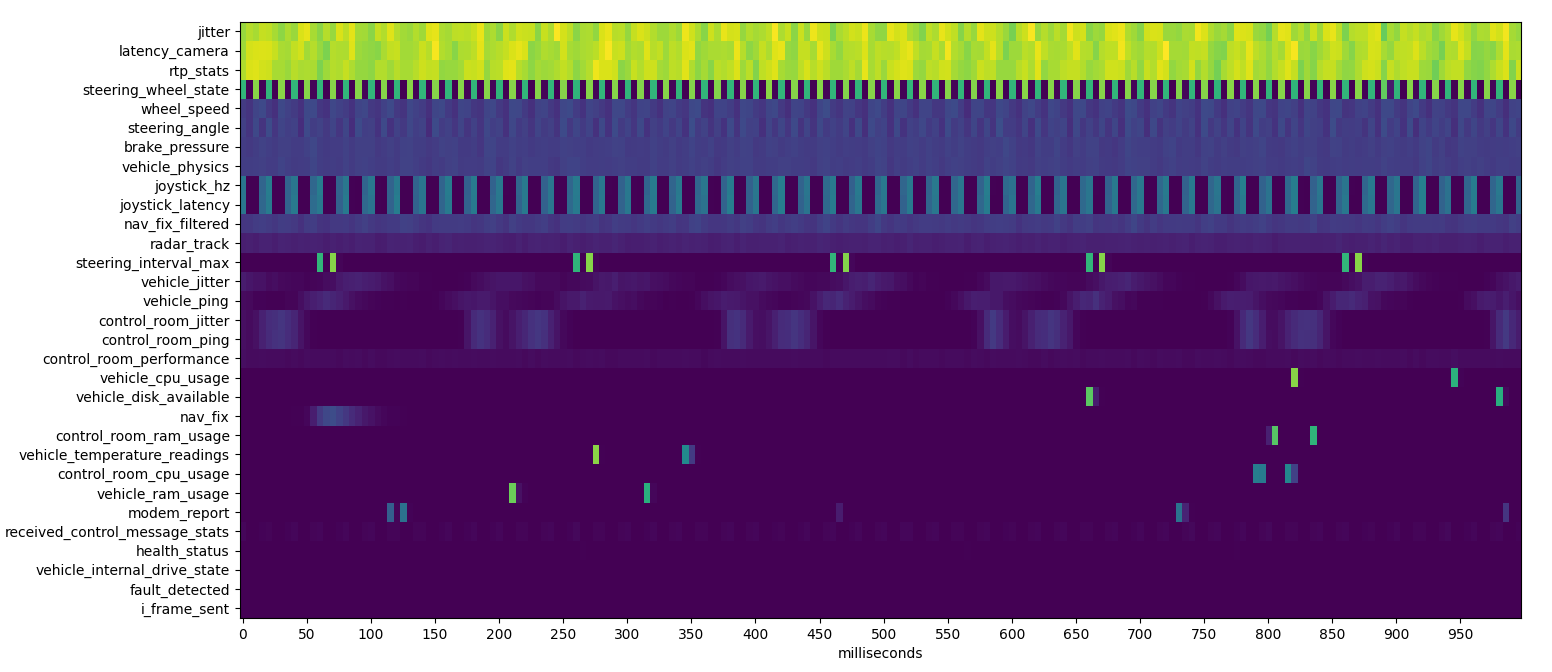 firing behaviour for telemetry features
Despite the visualization the features are not ingested regularly and some frequencies are pretty low
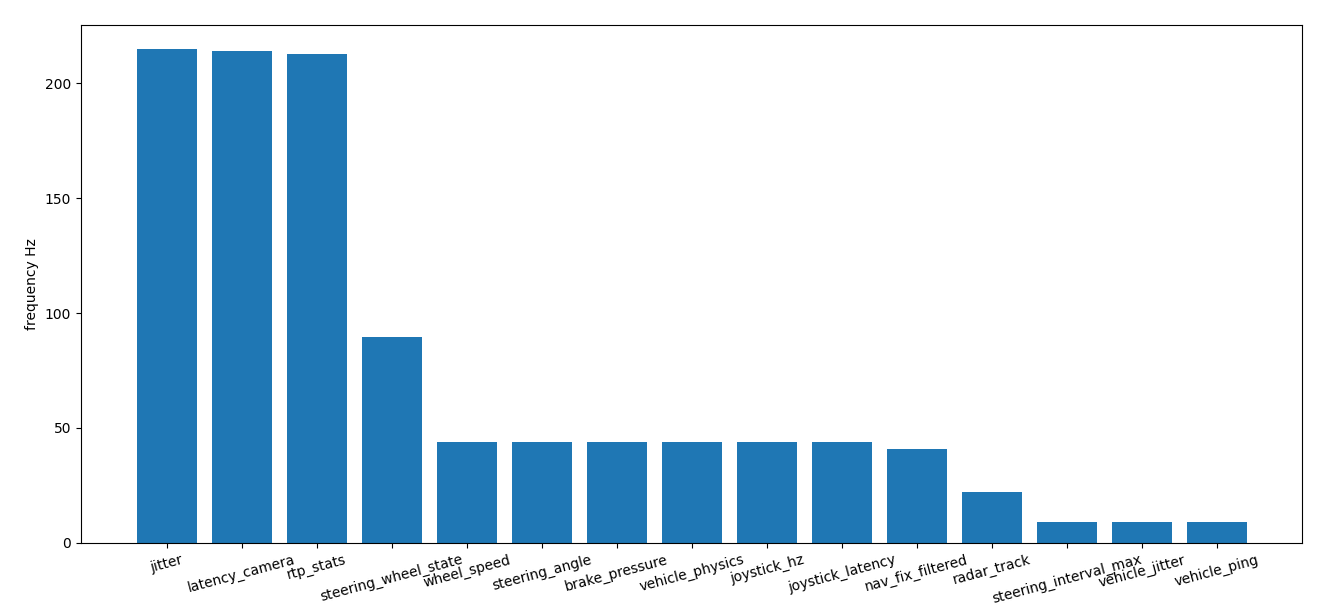 telemetry frequency
The data is than sent to the backend and arrives at
stream_ingestion_timestamp_ms and get processed at
processing_timestamp_ms by kinesis.
We see a clear delay between the time the topic publisher sends the data and kinesis process it
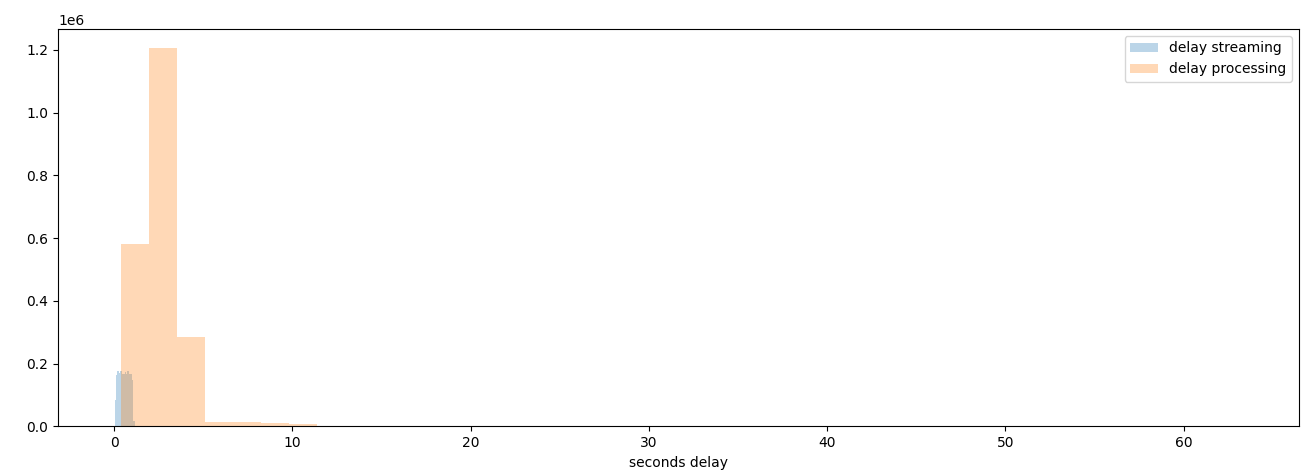 delay in processing the data, around 5 seconds as median
While the data arriving at the backend has at least 200ms delay till 1s. Streaming data has a curious cycle pattern to be further investigated.
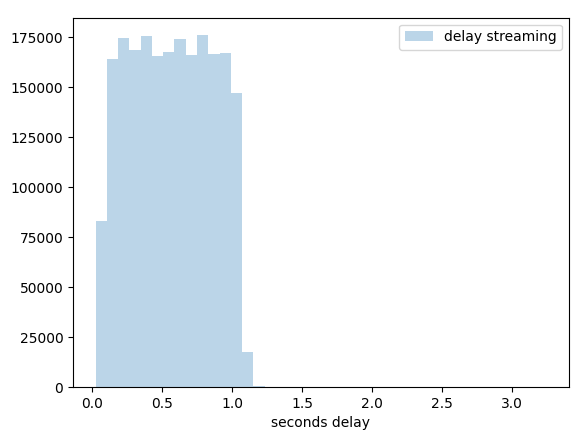 delay in streaming the data
We finally check that the latency is equal for all cameras
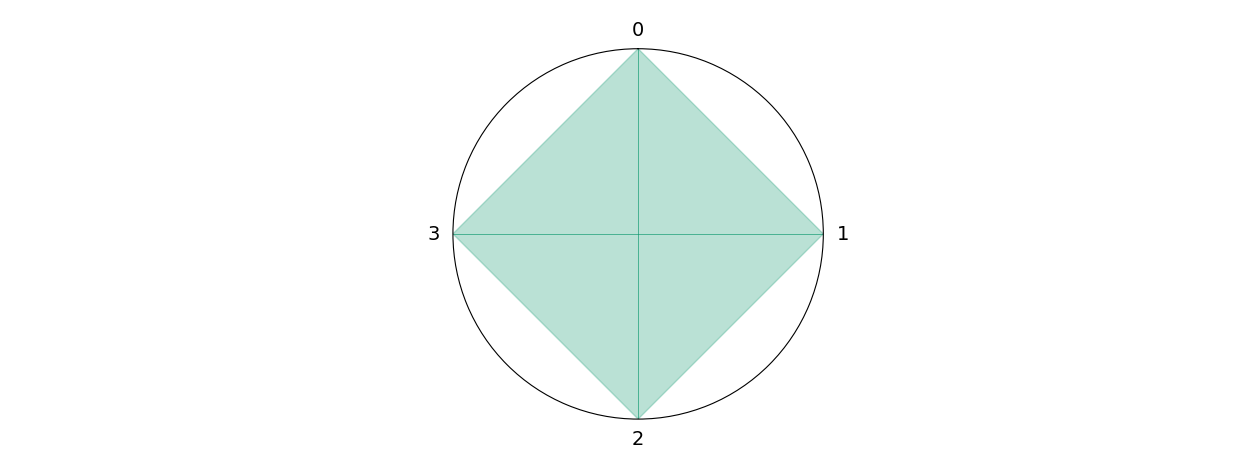 all 4 cameras have the same mean
latency
Source: proc_telemetry
Data is coming irregularly and values fluctuates artificially because of time buckets. We need to re write the data flow to have consistent data for the predictions.
We take cut the timestamp and calculate the deci seconds to create more consistent time bins
 resampling time bins
We still have many empty values and we create a rolling window to replace the missing values with the running average
 running average over the previous and successive 3 records
We mainly use athena to download the data but we have a strong preference for spark since it enables a more careful and complete workflow moving from simple queries to a complete software design
Athena limitations:
null in averagesWe than avoid all arithmetic operations in athena to avoid fake zeros.
Query network_log.sql Code stat_network.py
We analyze the network data to understand which features should be joined with the telemetry table.
The series have many empty values
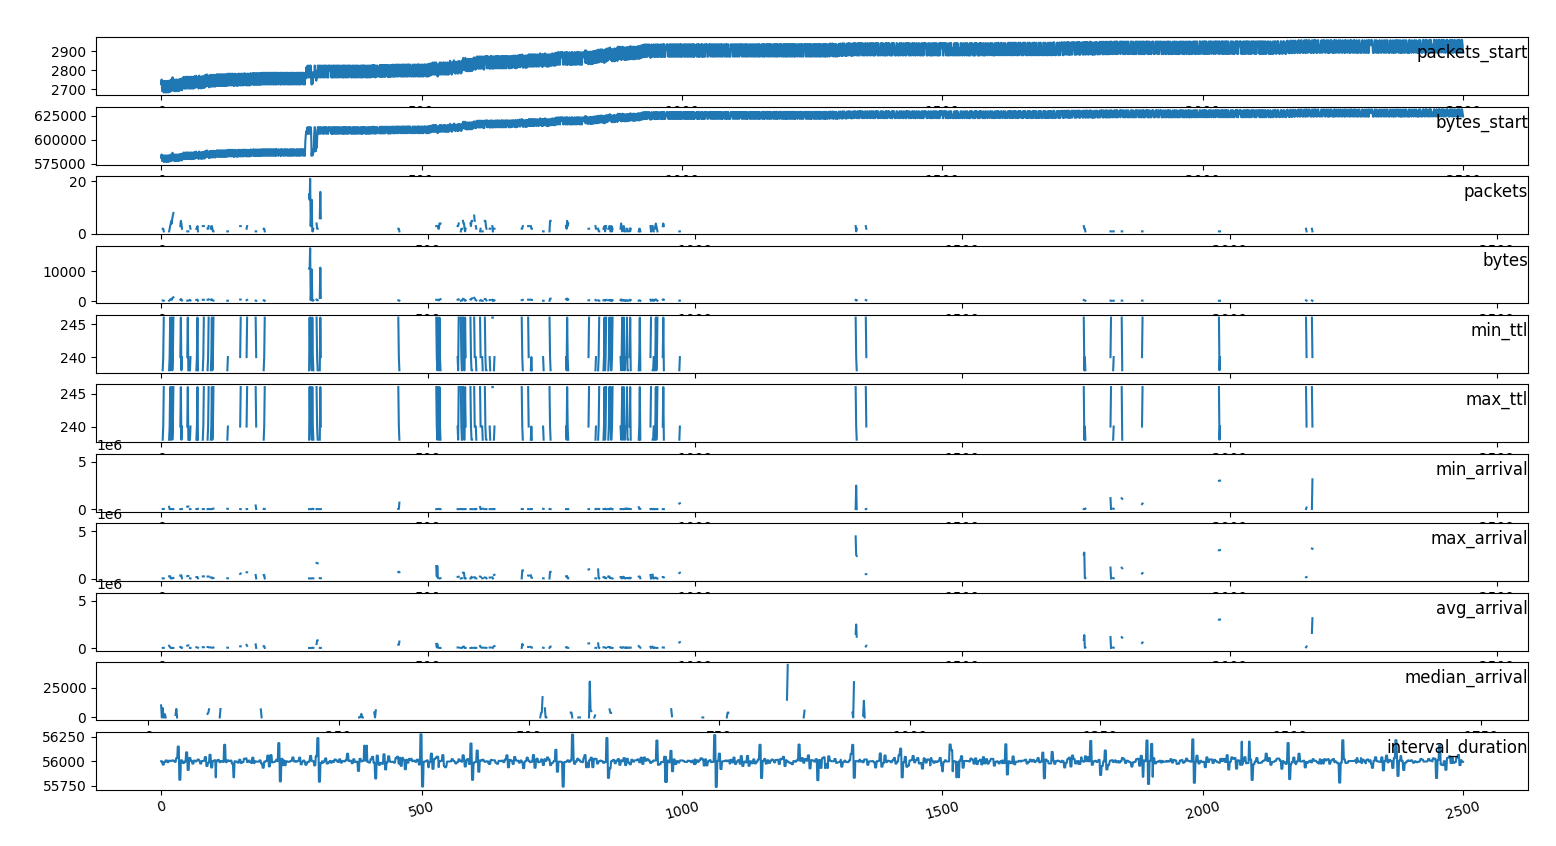 time series network features
Distributions are pretty narrow and have many outliers, not all cameras have the same network figure.
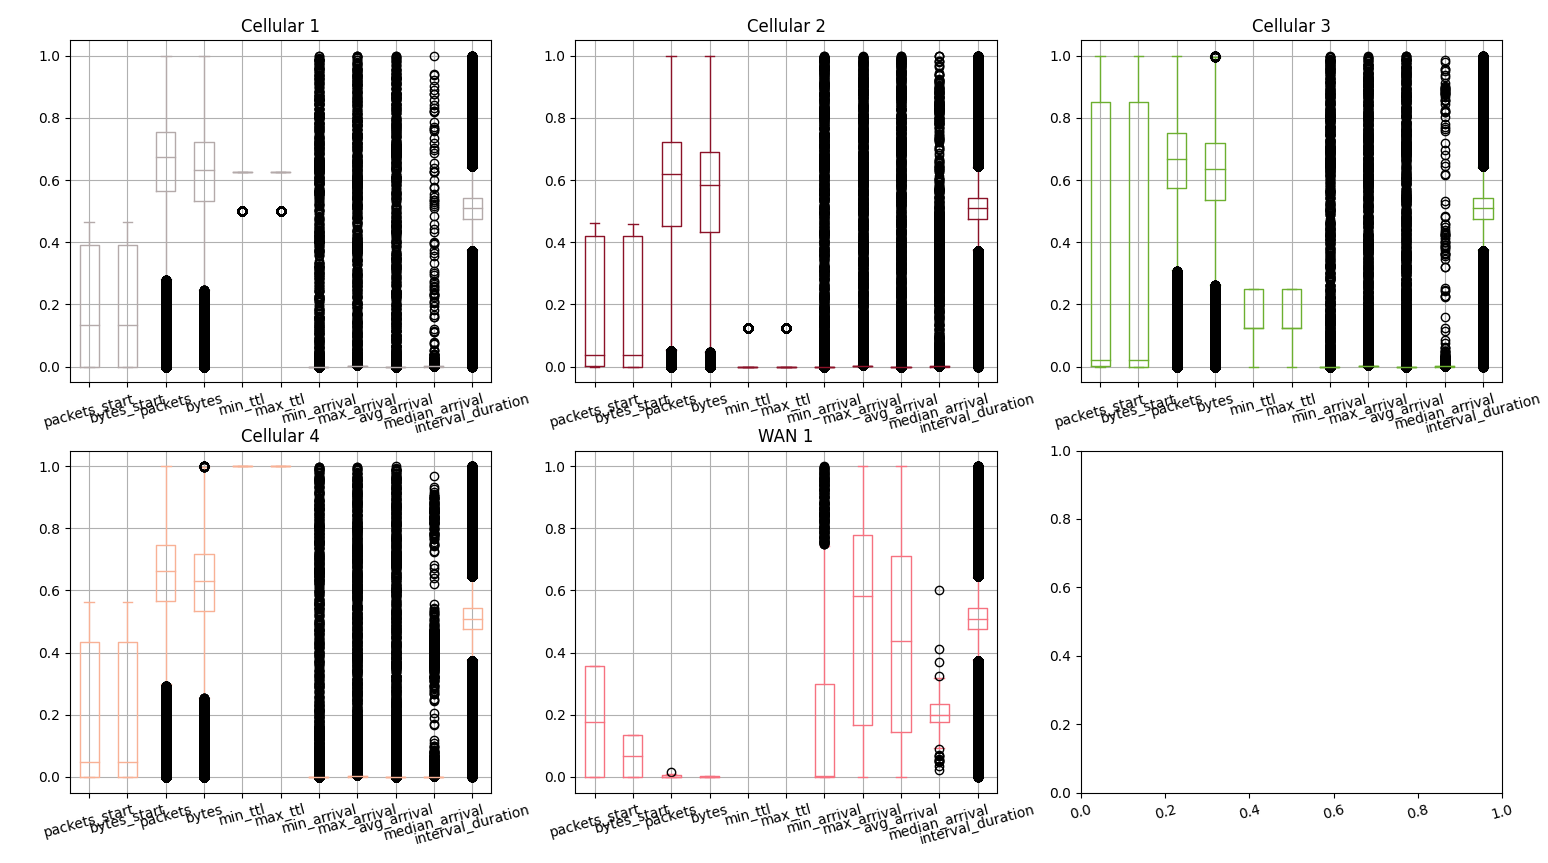 boxplot of network features
Some features correlate and can be neglected
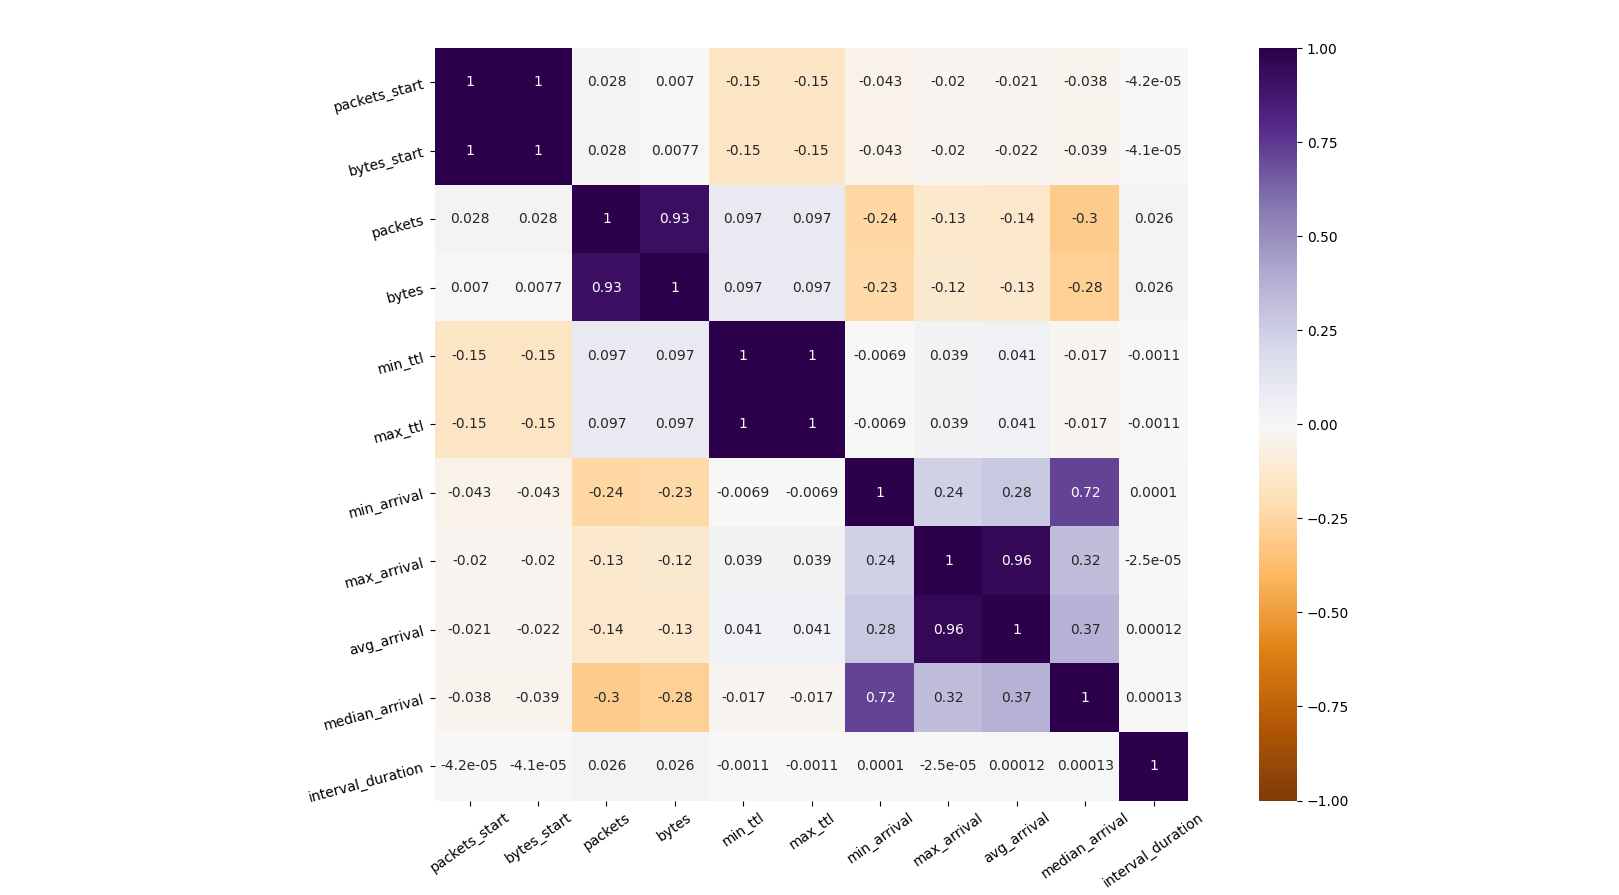 correlation across network
features
Some features work in particular regimes and are multimodal
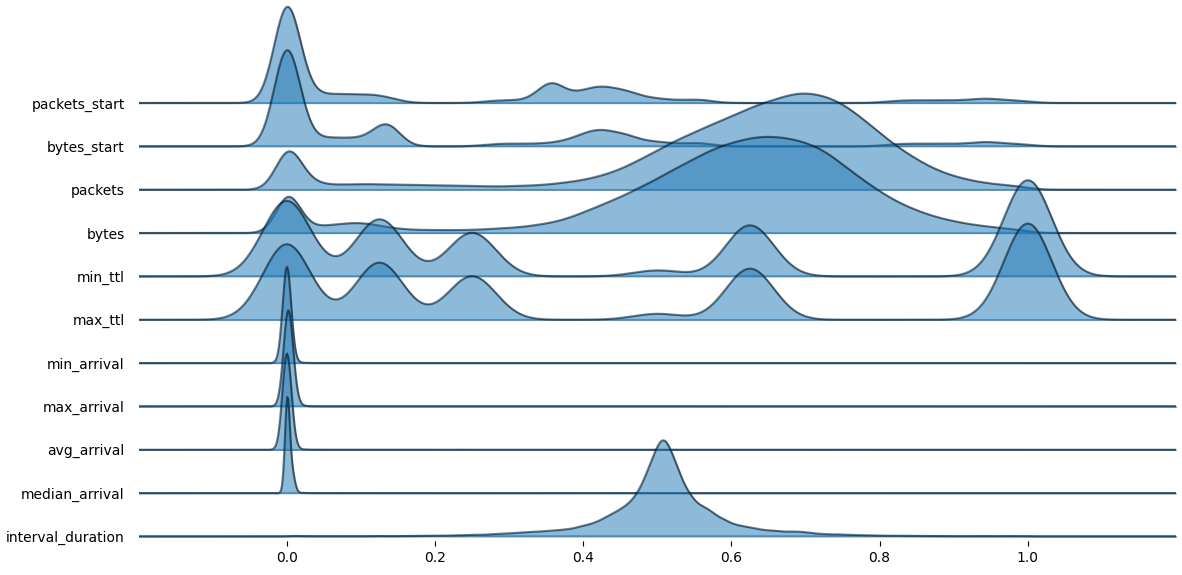 network joyplot
Modem data are clearly multimodal
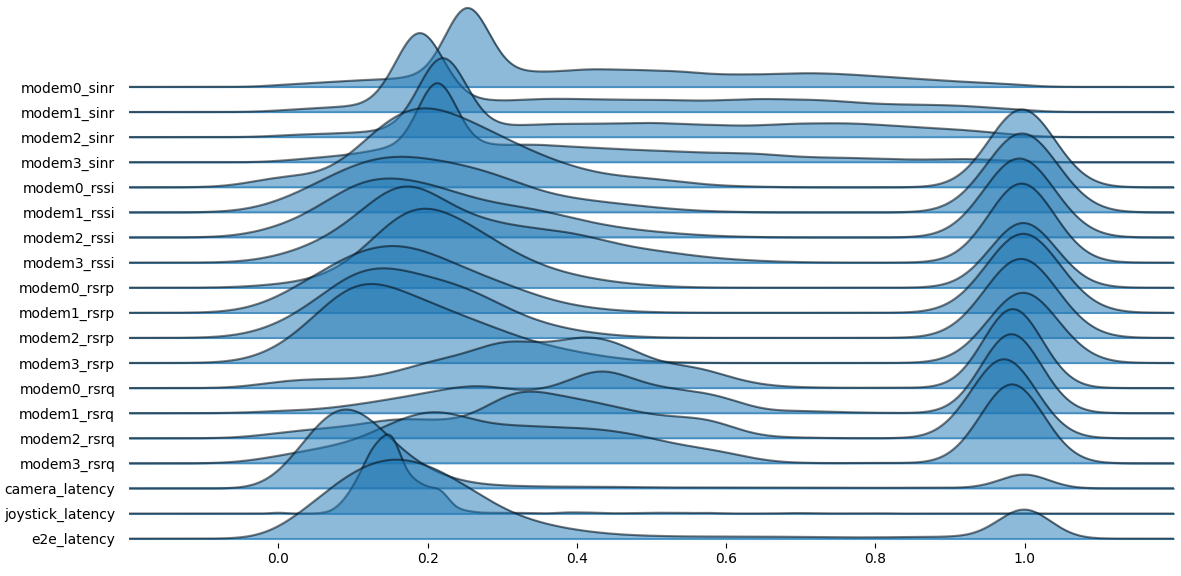 joyplot
for modem data
We join the the telemetry table with the
network_log table to explore additional features but the
new sources are even more noisy
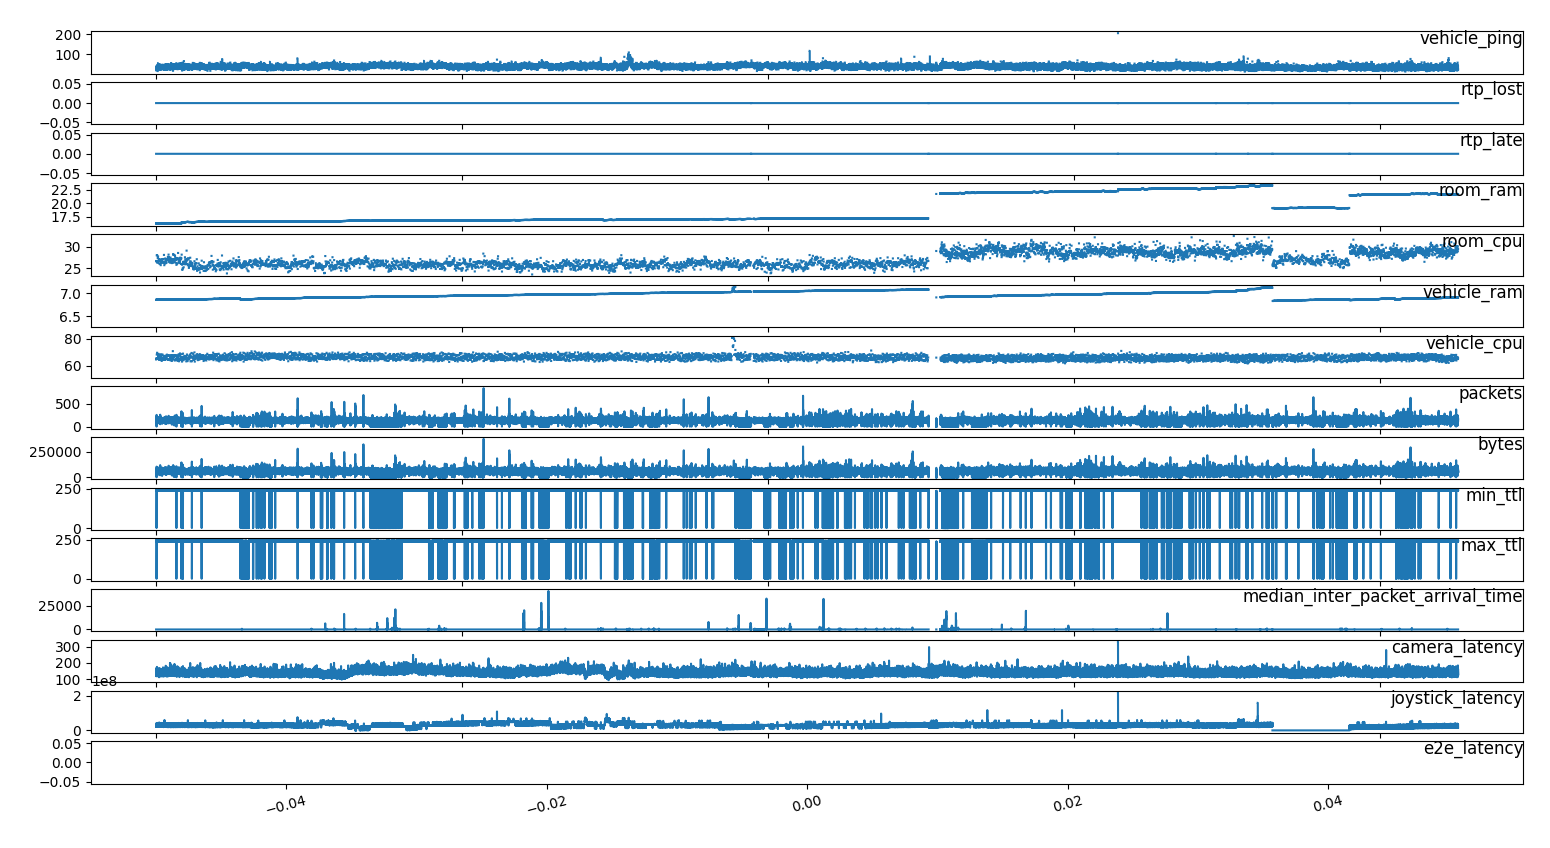 joined
network_log and telemetry tables
Source: etl_telemetry_deci Query: network_log.sql
We analyze the time series for the modem features
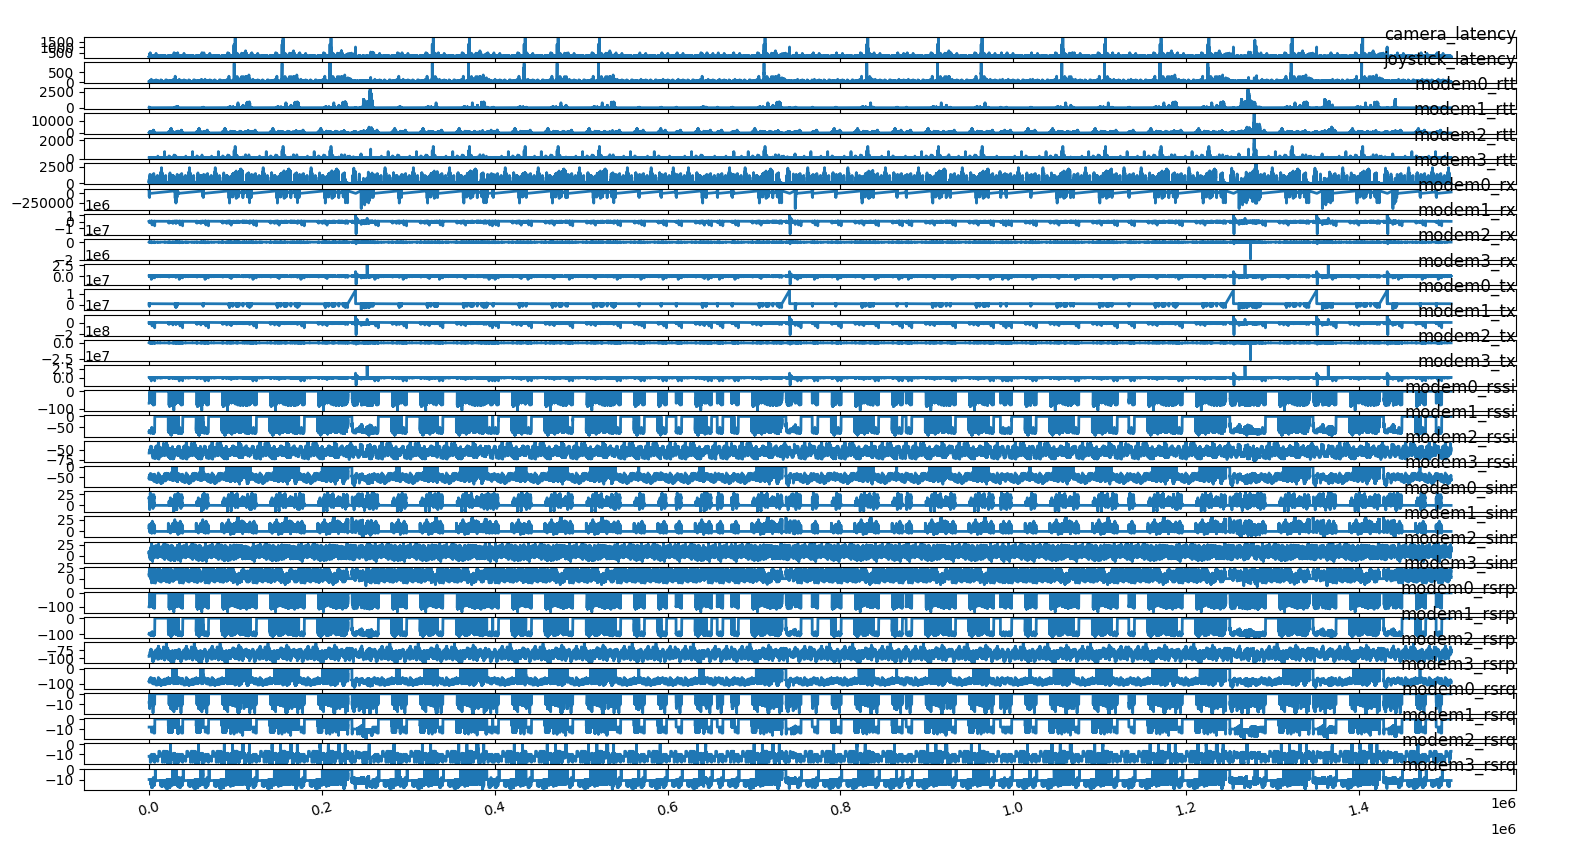 time
series of features
and correlate the features
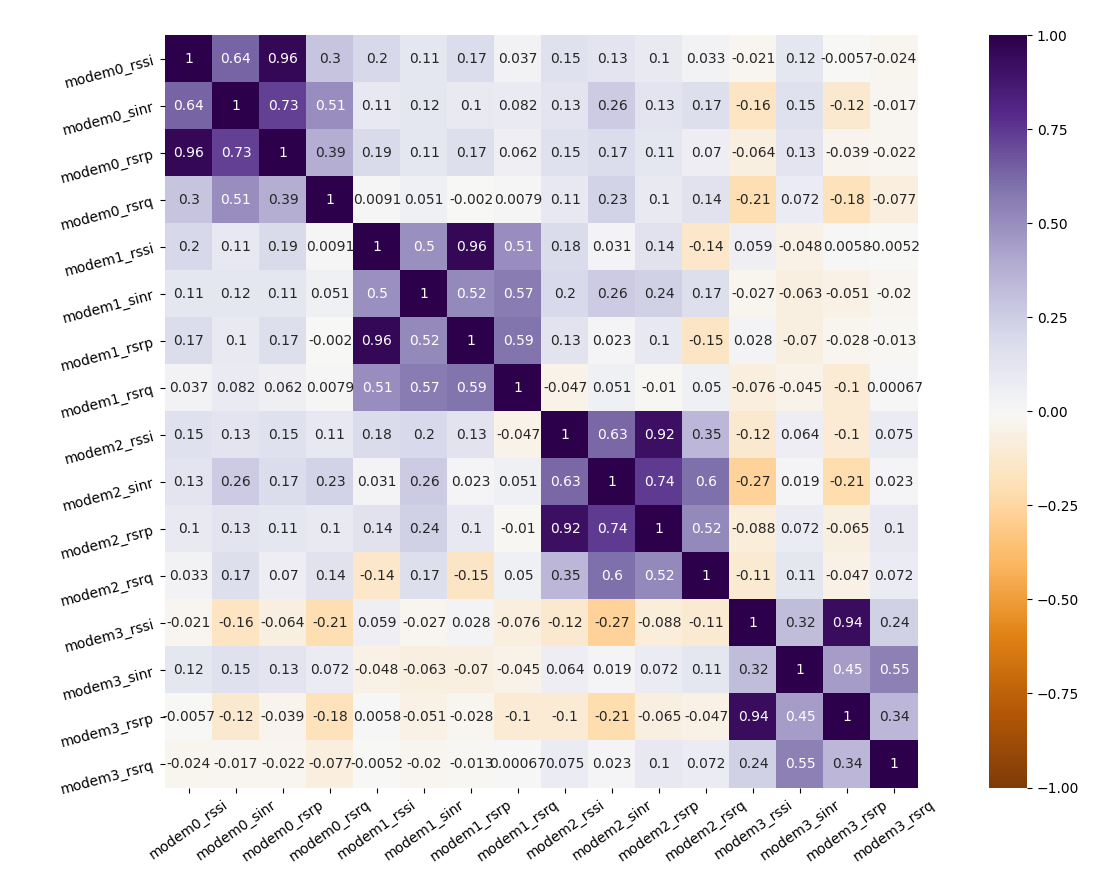 correlation between modems
We show that interpolation on deci seconds creates many artefacts
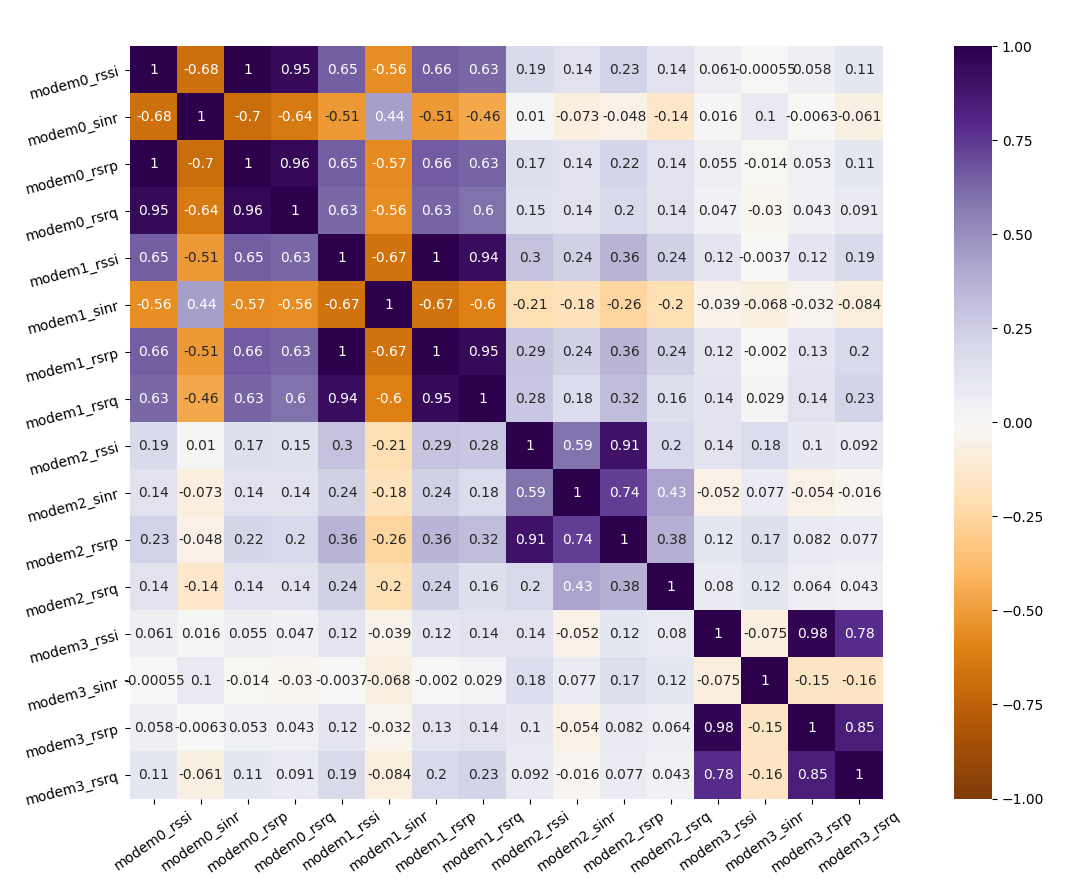 correlation between modems
We display the feature correlation per modem
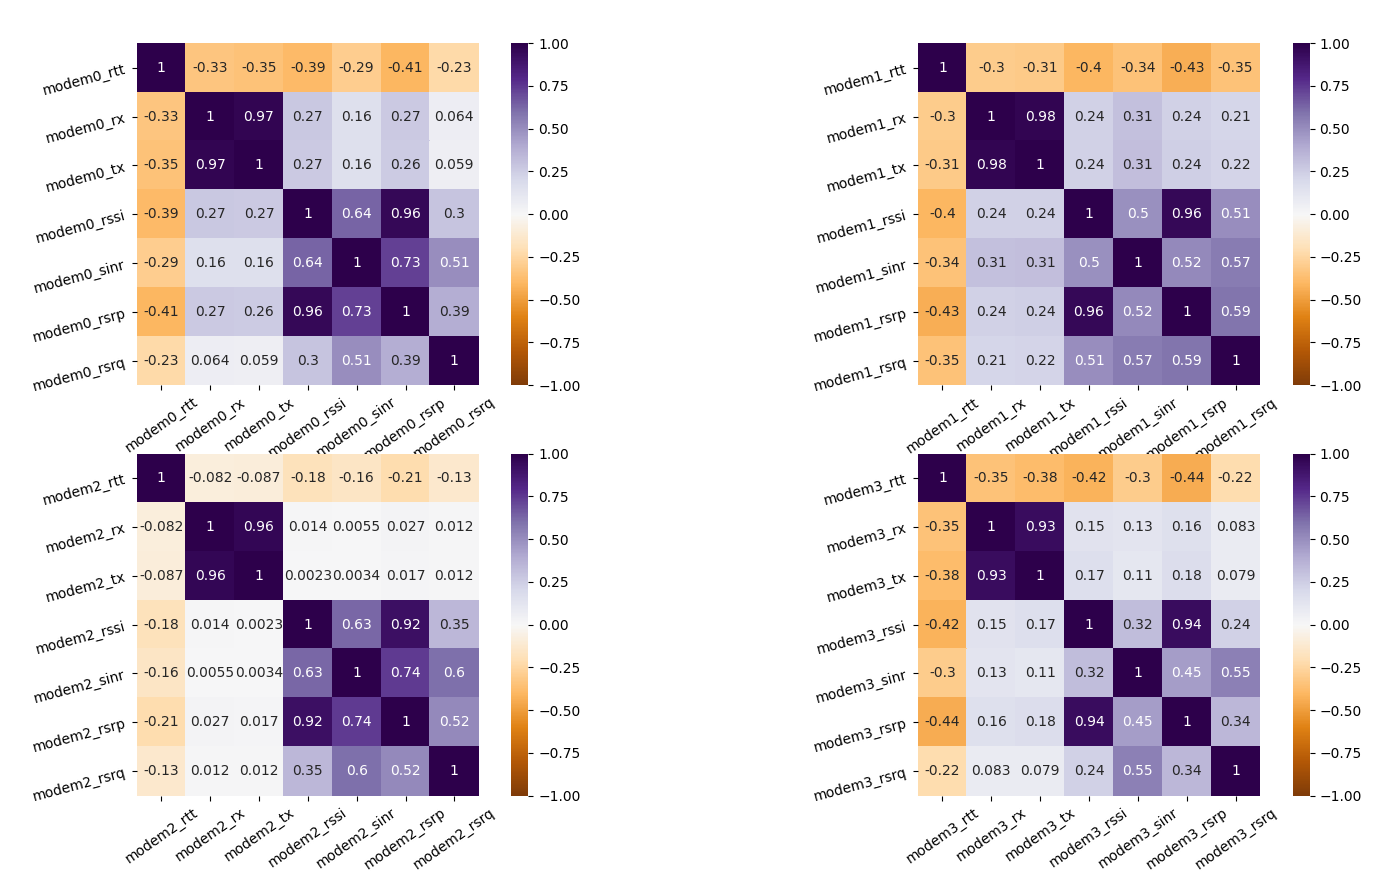 feature correlation per modem
We see that upload and download information is redundant
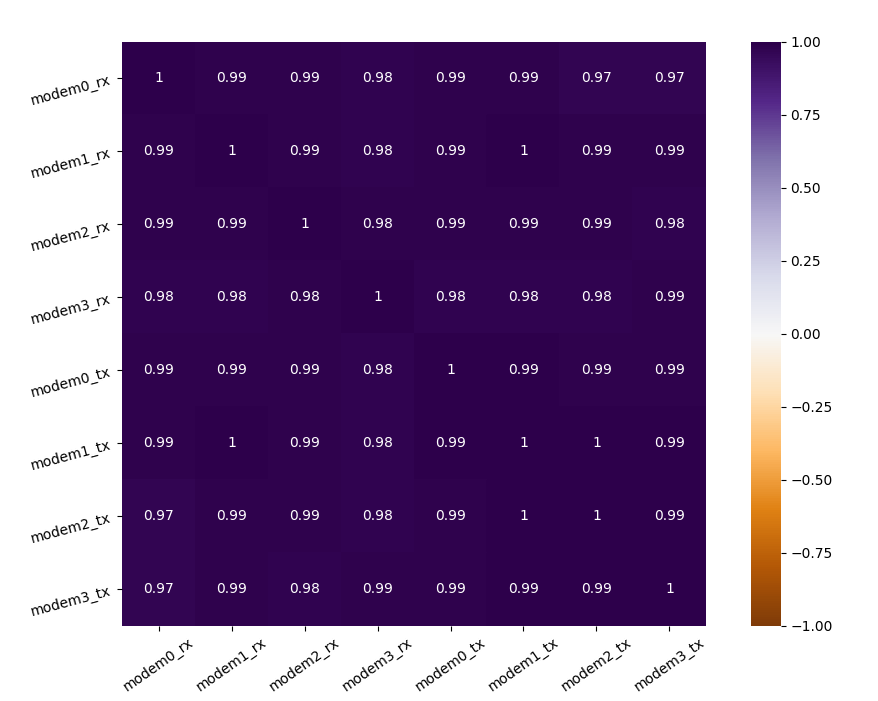 modem upload and download
More interesting is the information in the signal features
we clearly see a correlation between the two D-netz modems (1 and 2)
and we keep sinr and rssi
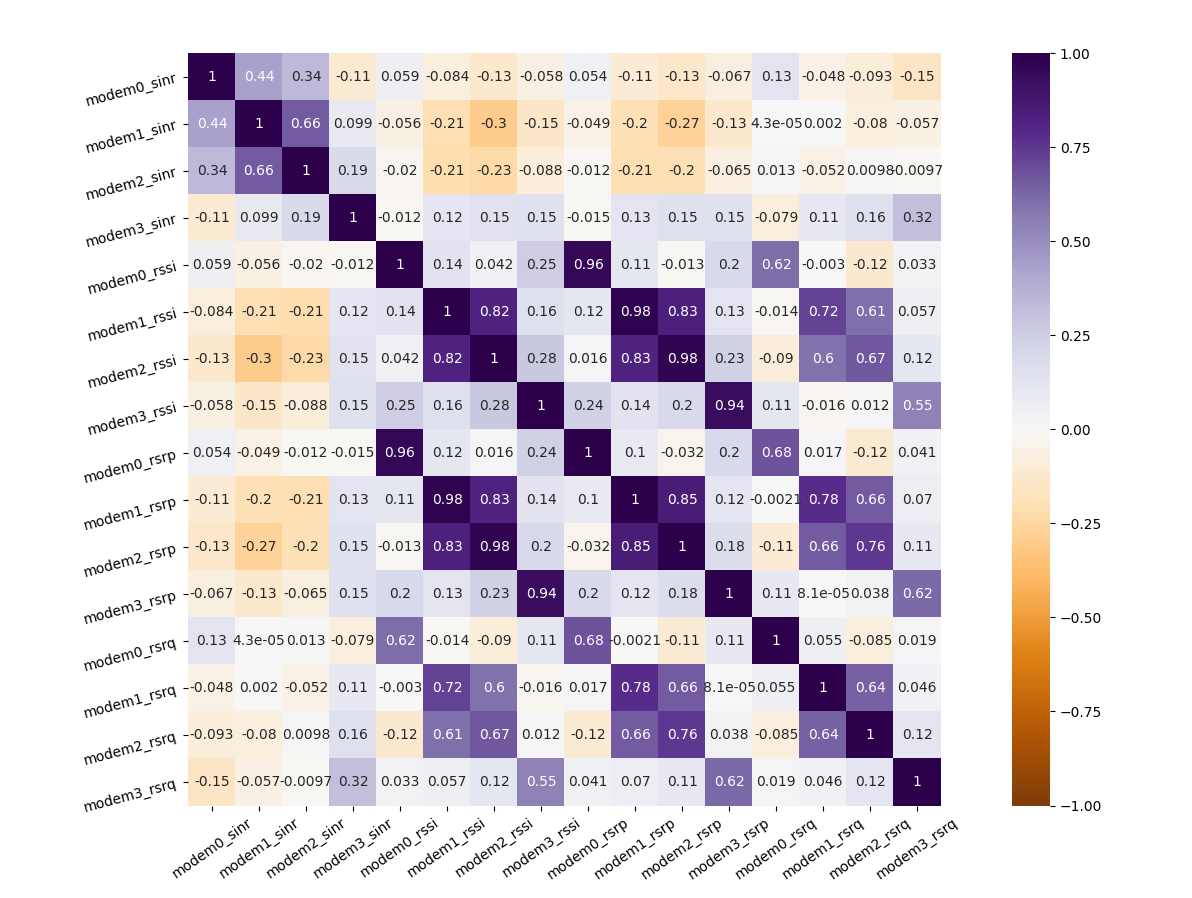 correlation of the modem signal features
sinr and rssi are the most rich
features
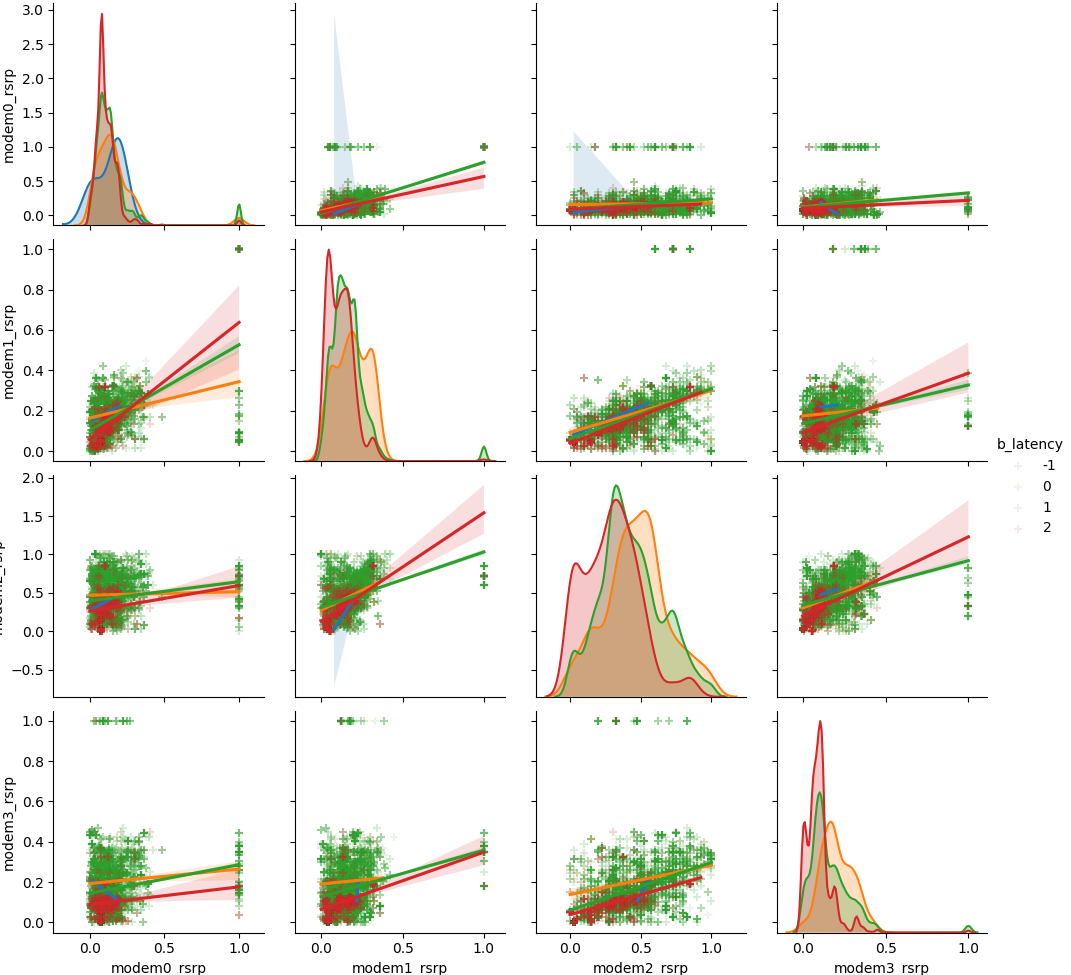 pairplot
of the rsrp features
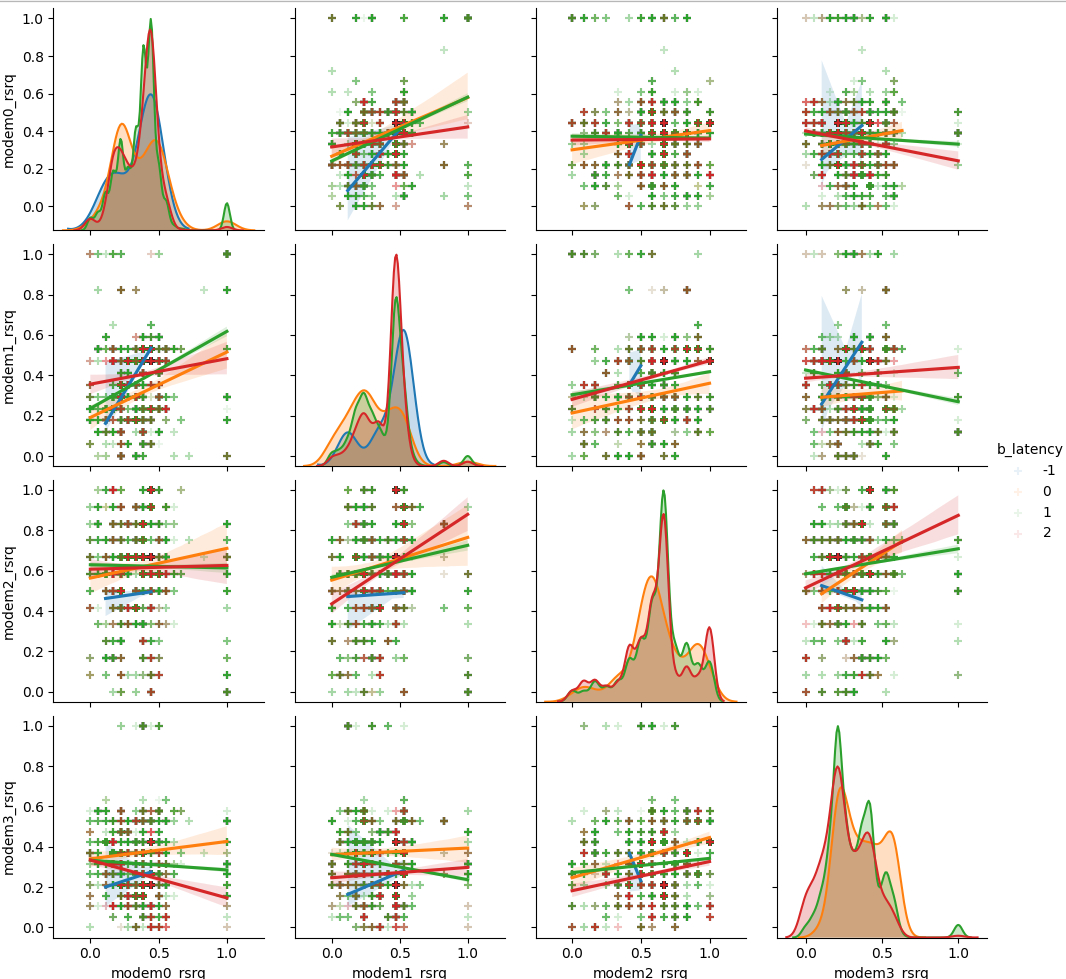 pairplot
of the rsrp features
 pairplot of
the rsrp features
 pairplot
of the rsrp features
We see that most of the features have to distinguished regimes
 joyplot
of modem features
We see a different persistance depending on the modem we consider
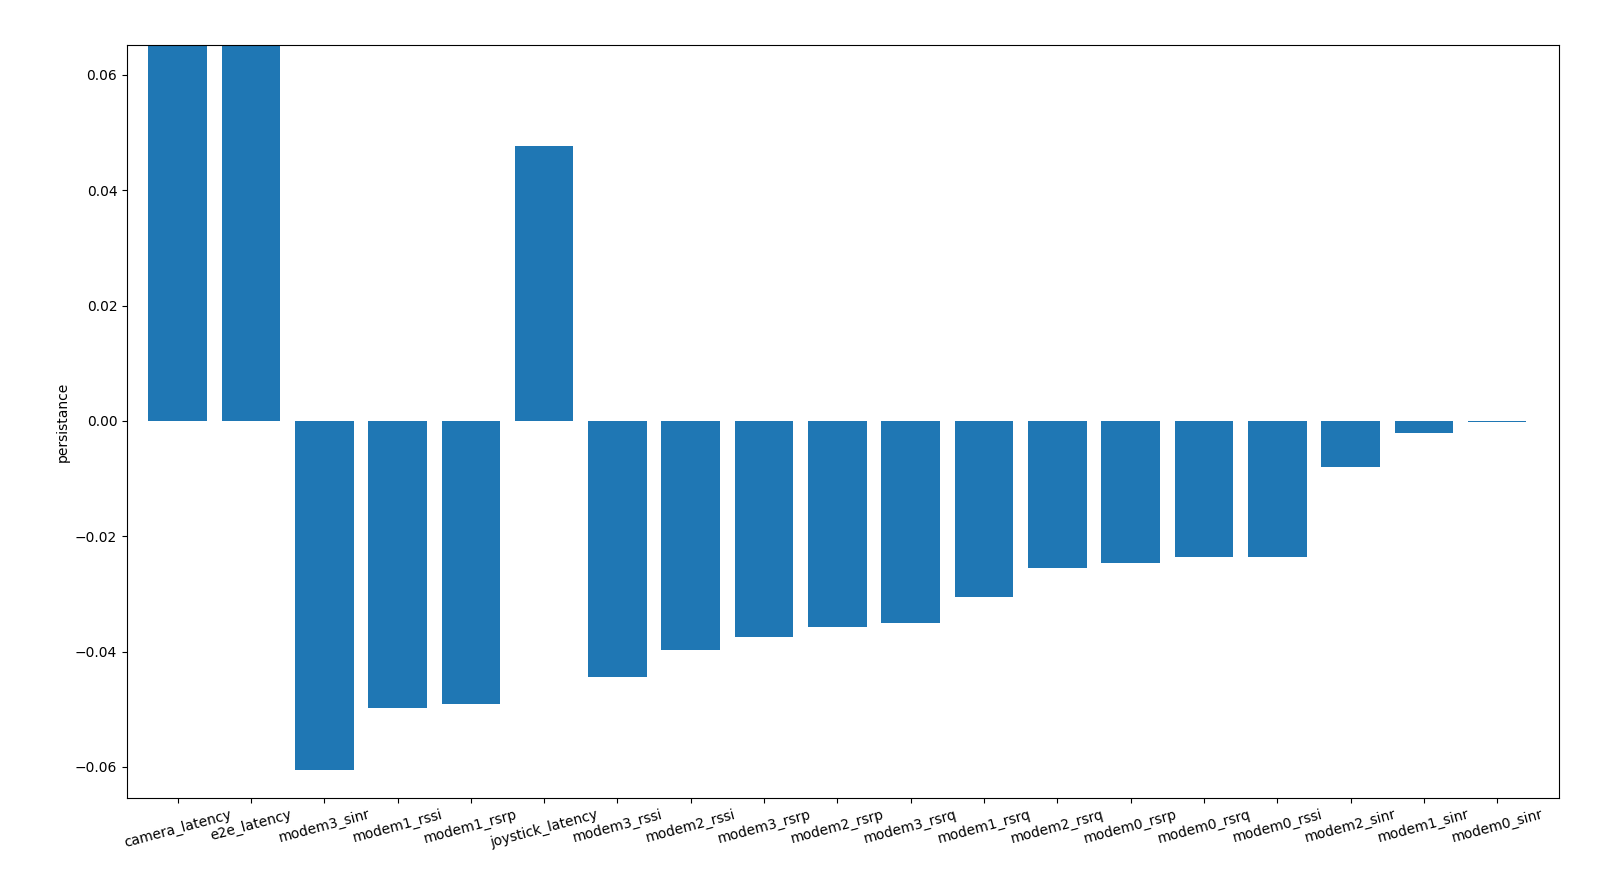 modem feature persistance
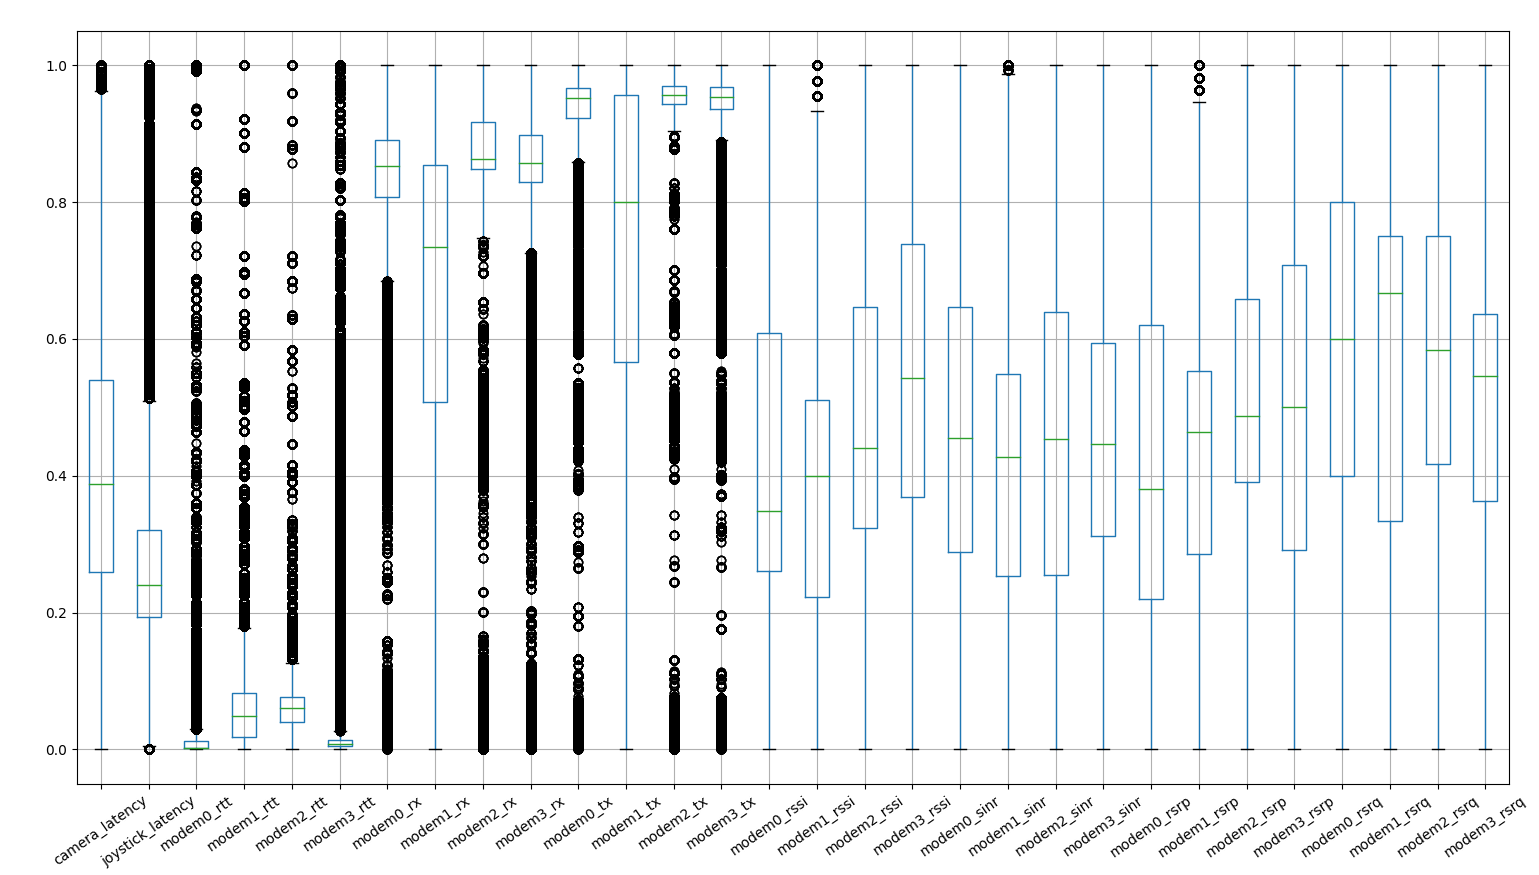 boxplot of modem features
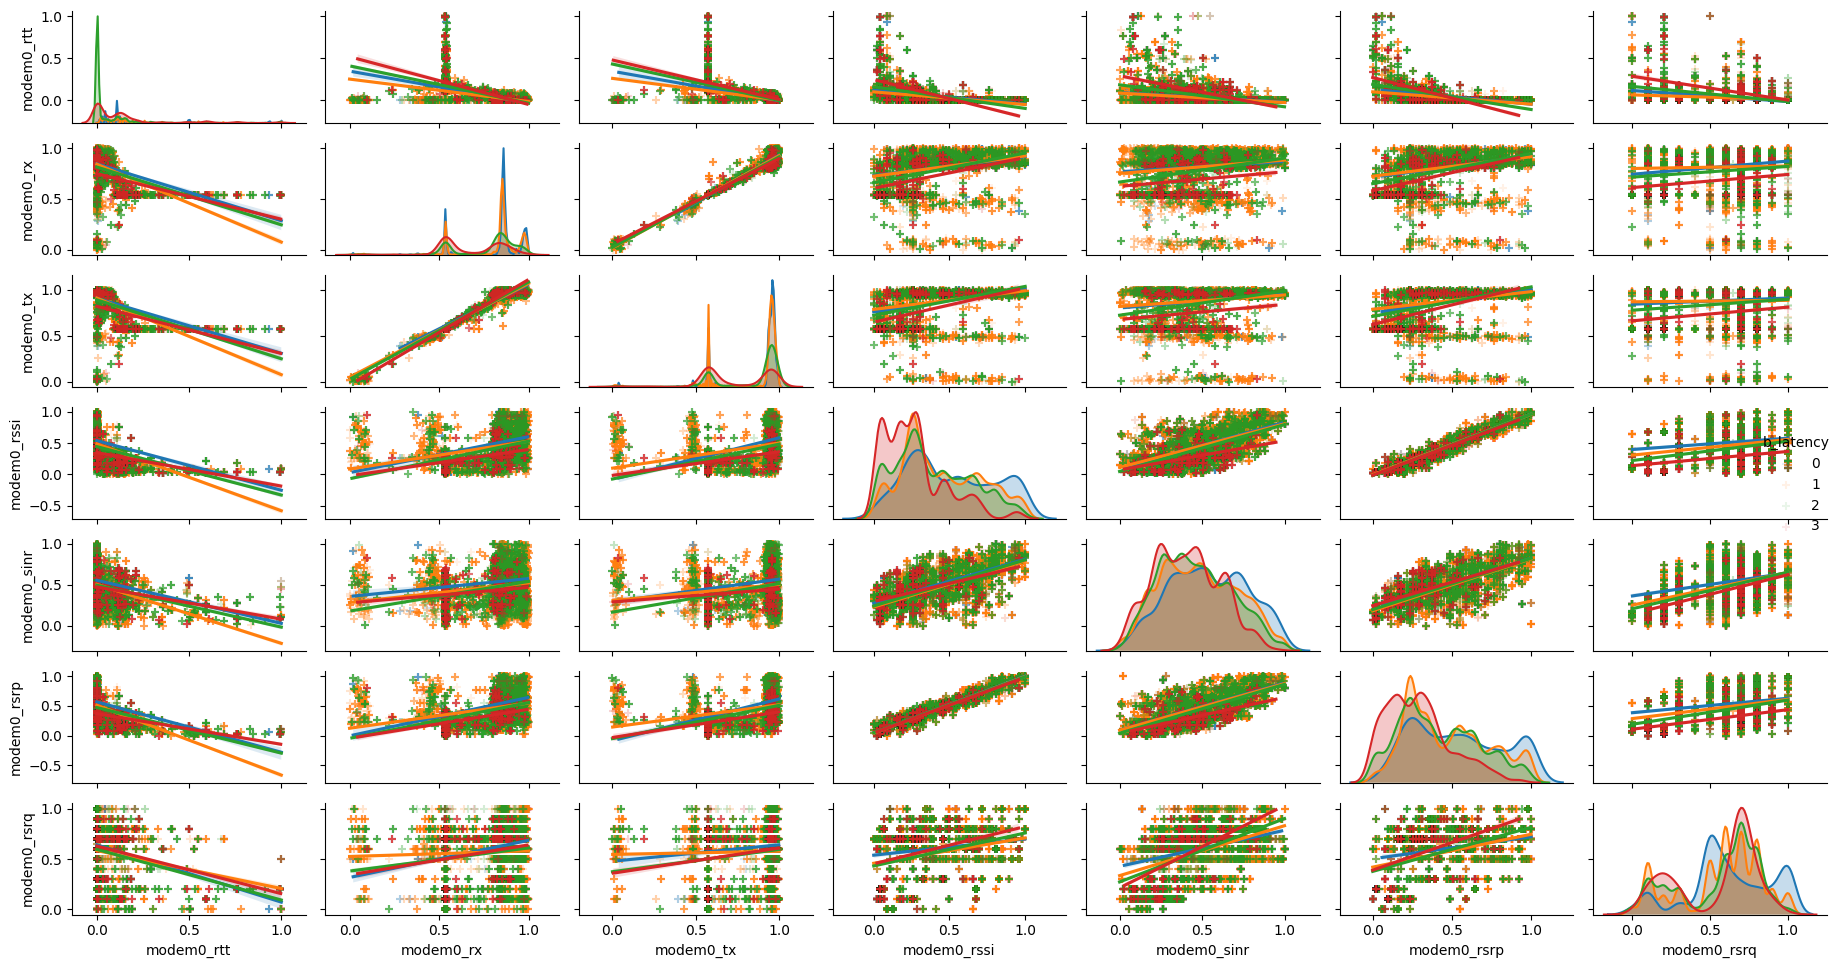 pair
plot of modem 0
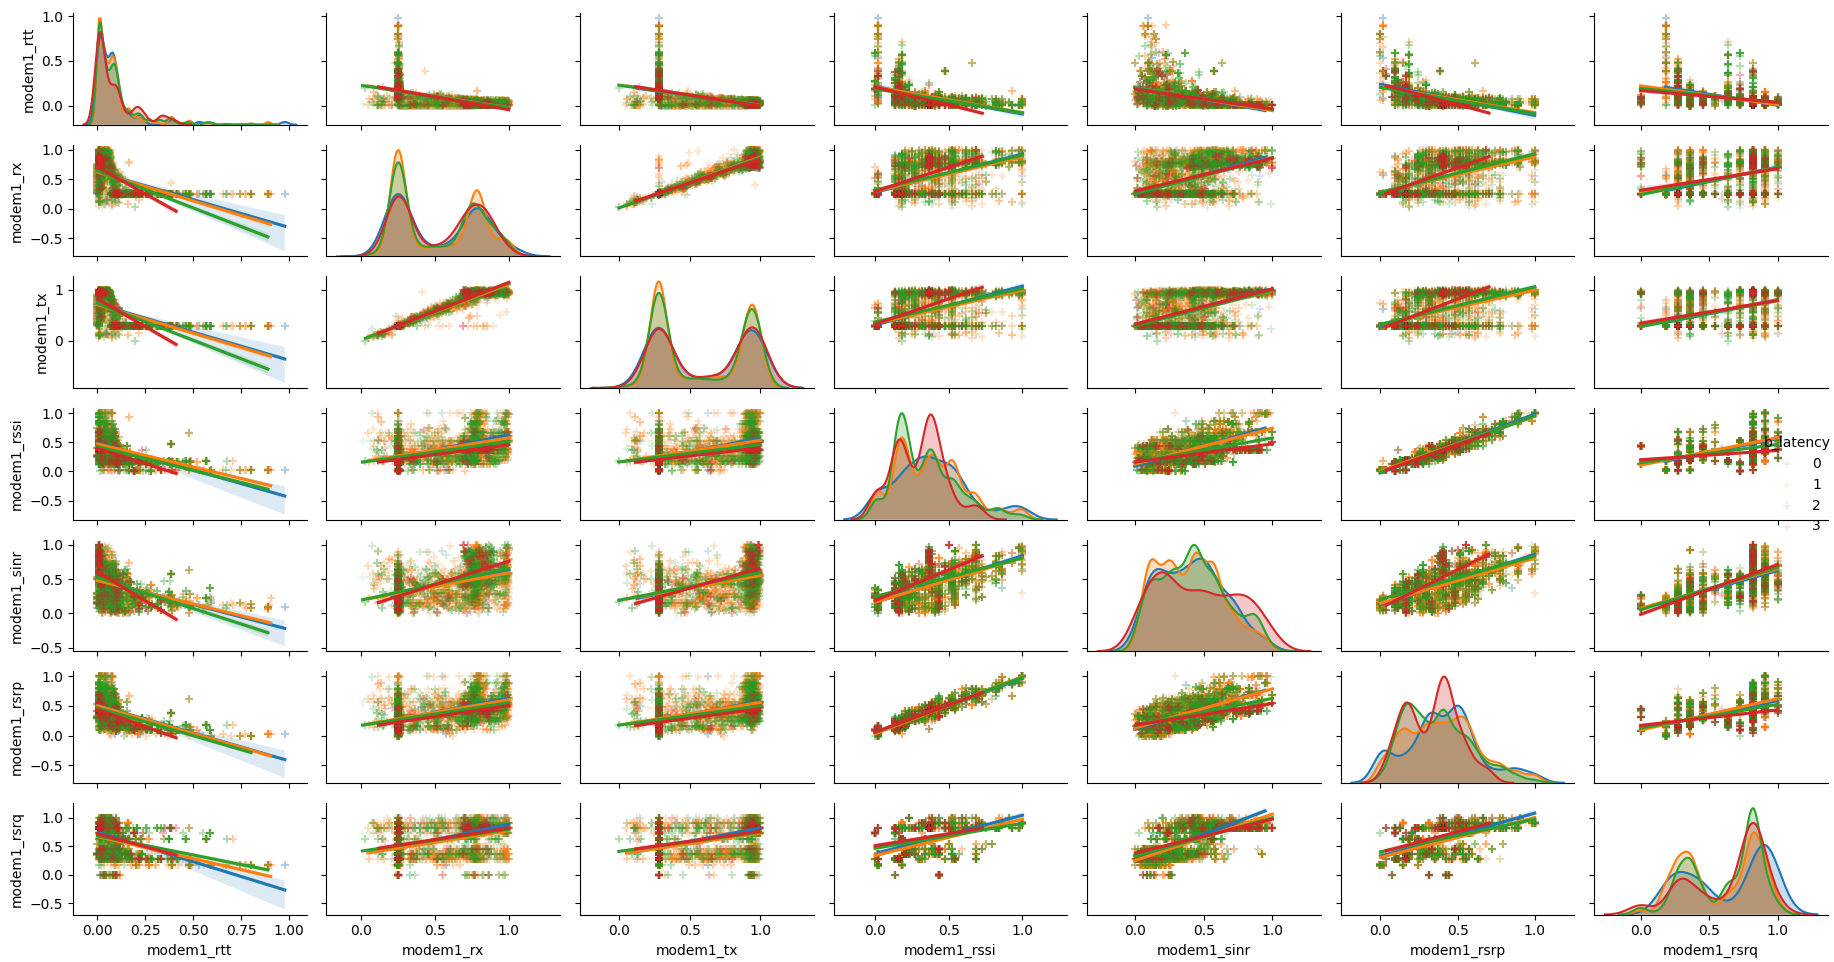 pair
plot of modem 1
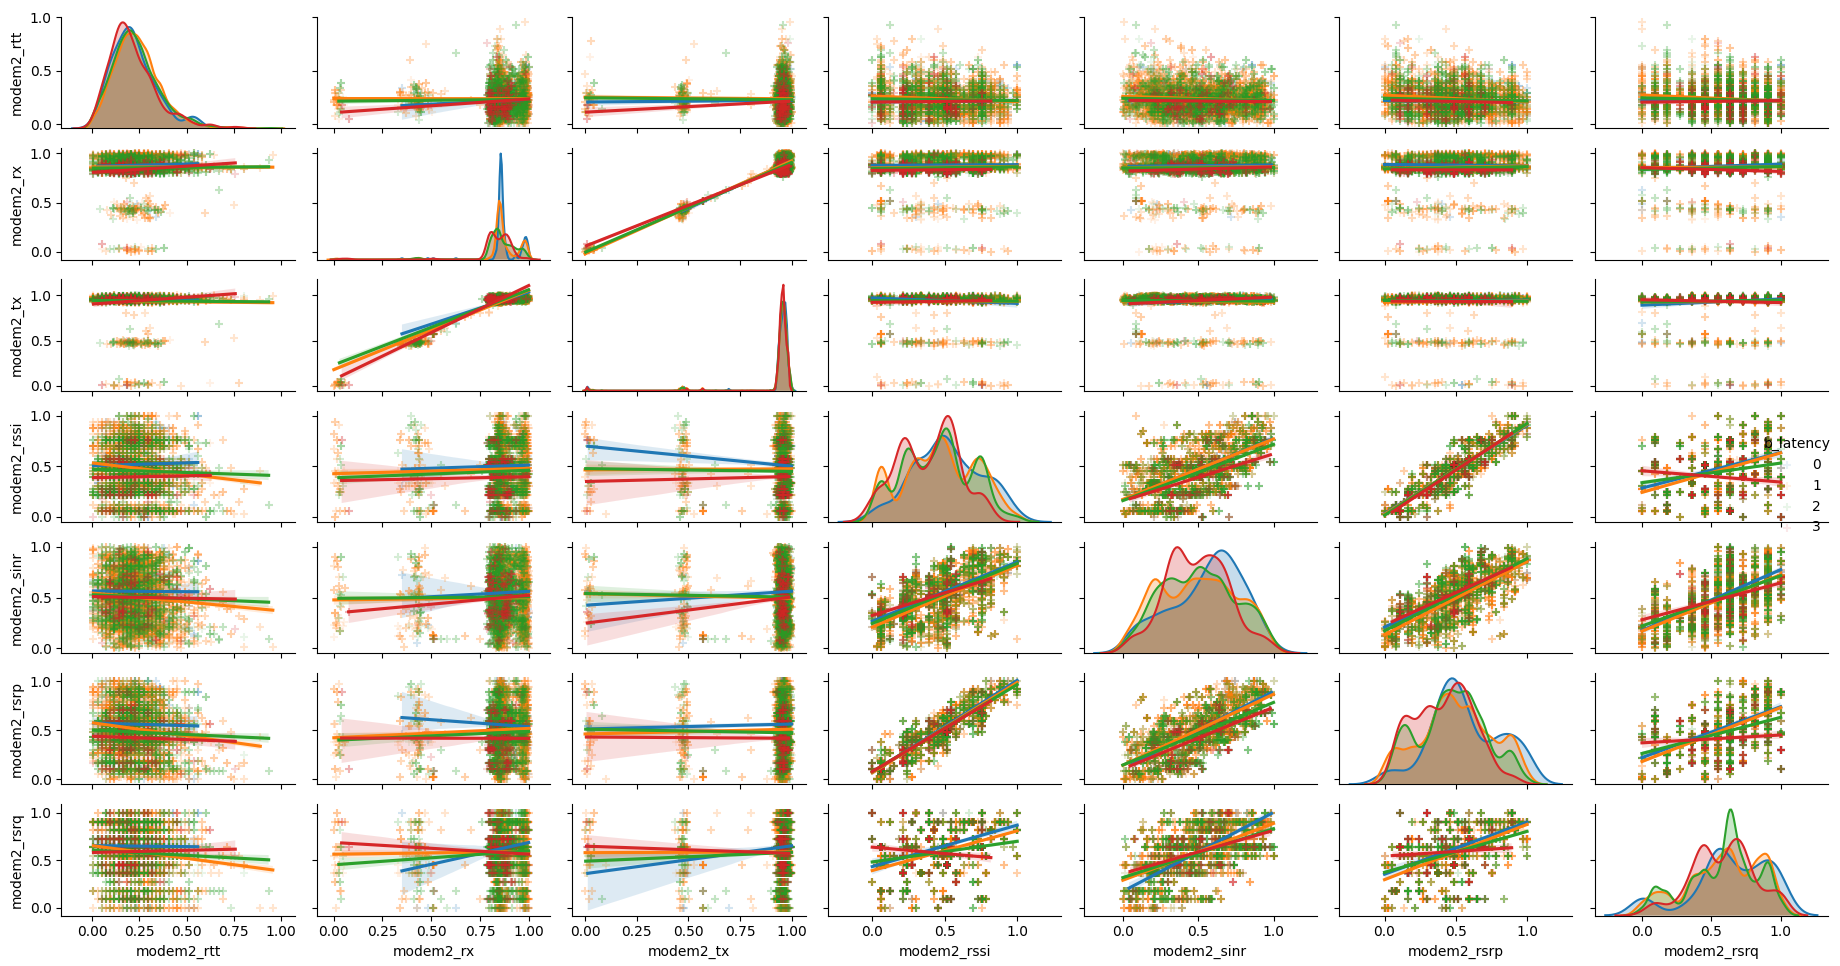 pair
plot of modem 2
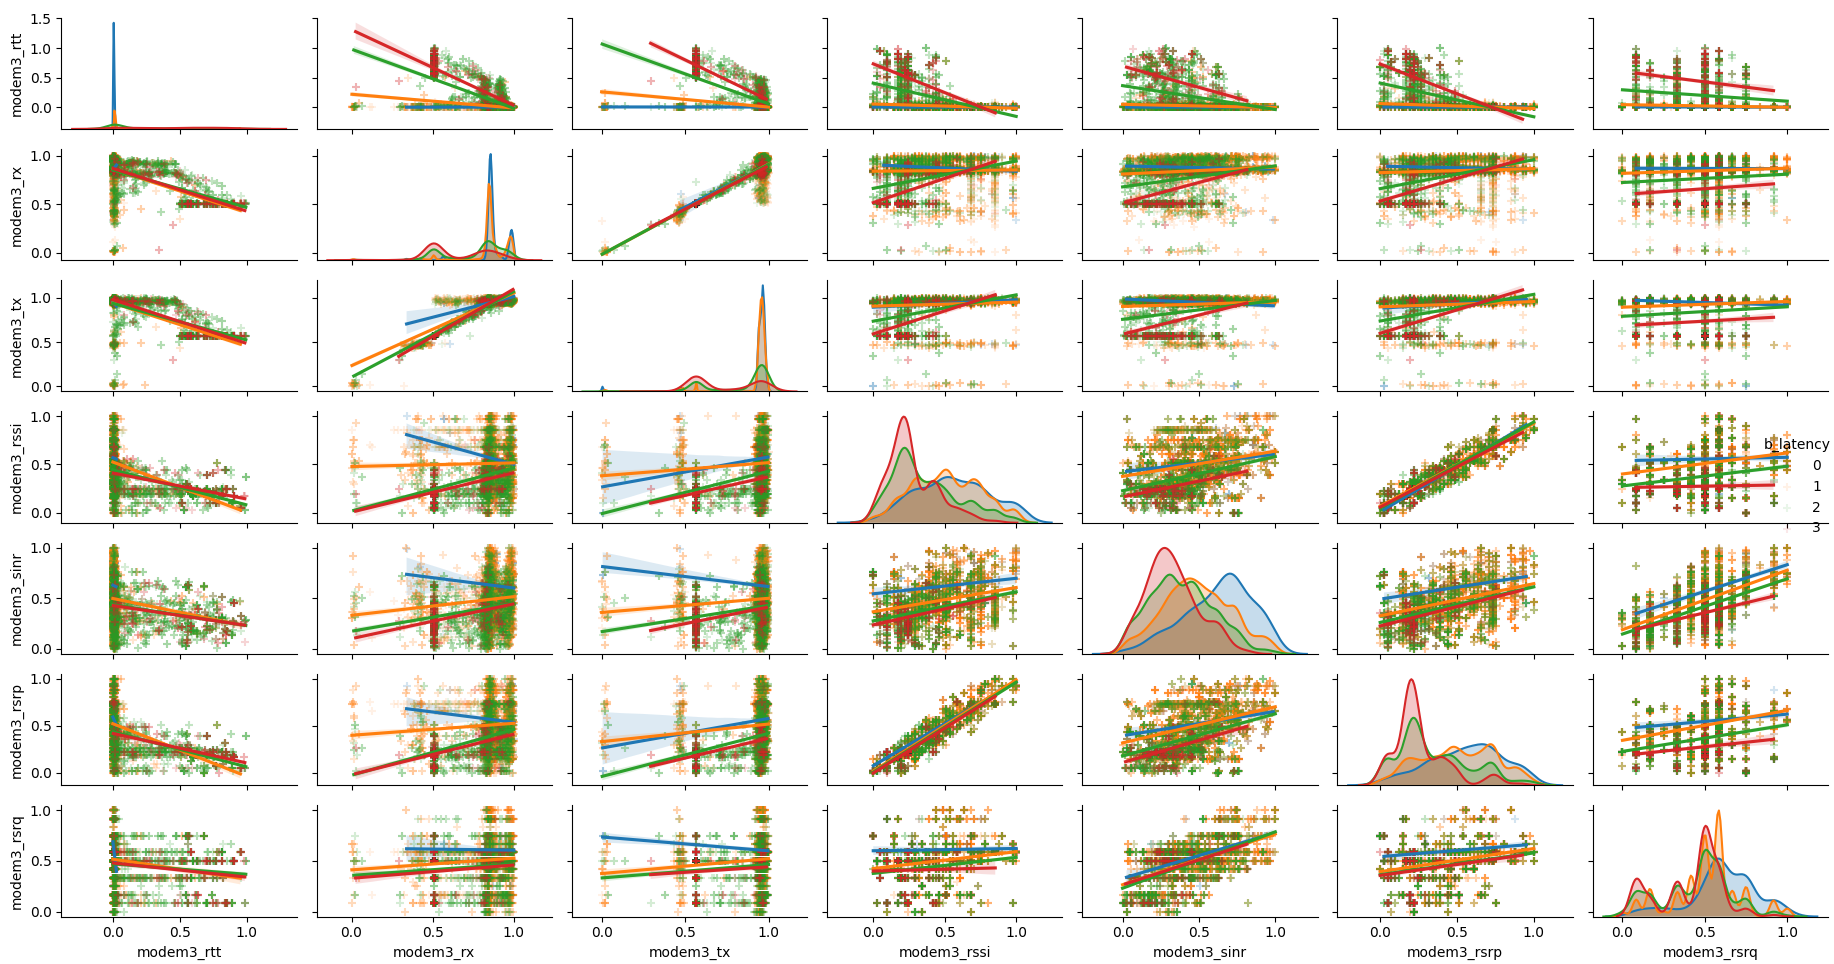 pair
plot of modem 3
We see that during a spike (camera_latency > 300) all
cameras have similar latencies
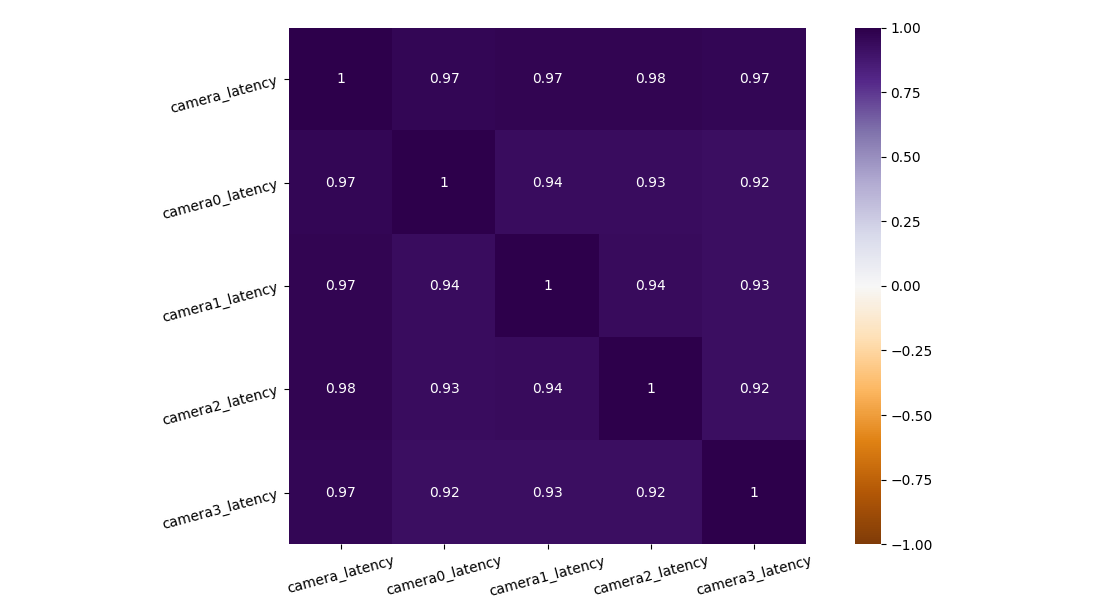 correlation of camera latency during a spike ## session
time
We see that some quantities are dependent from the
session_time which is the time since the starting of the
session.
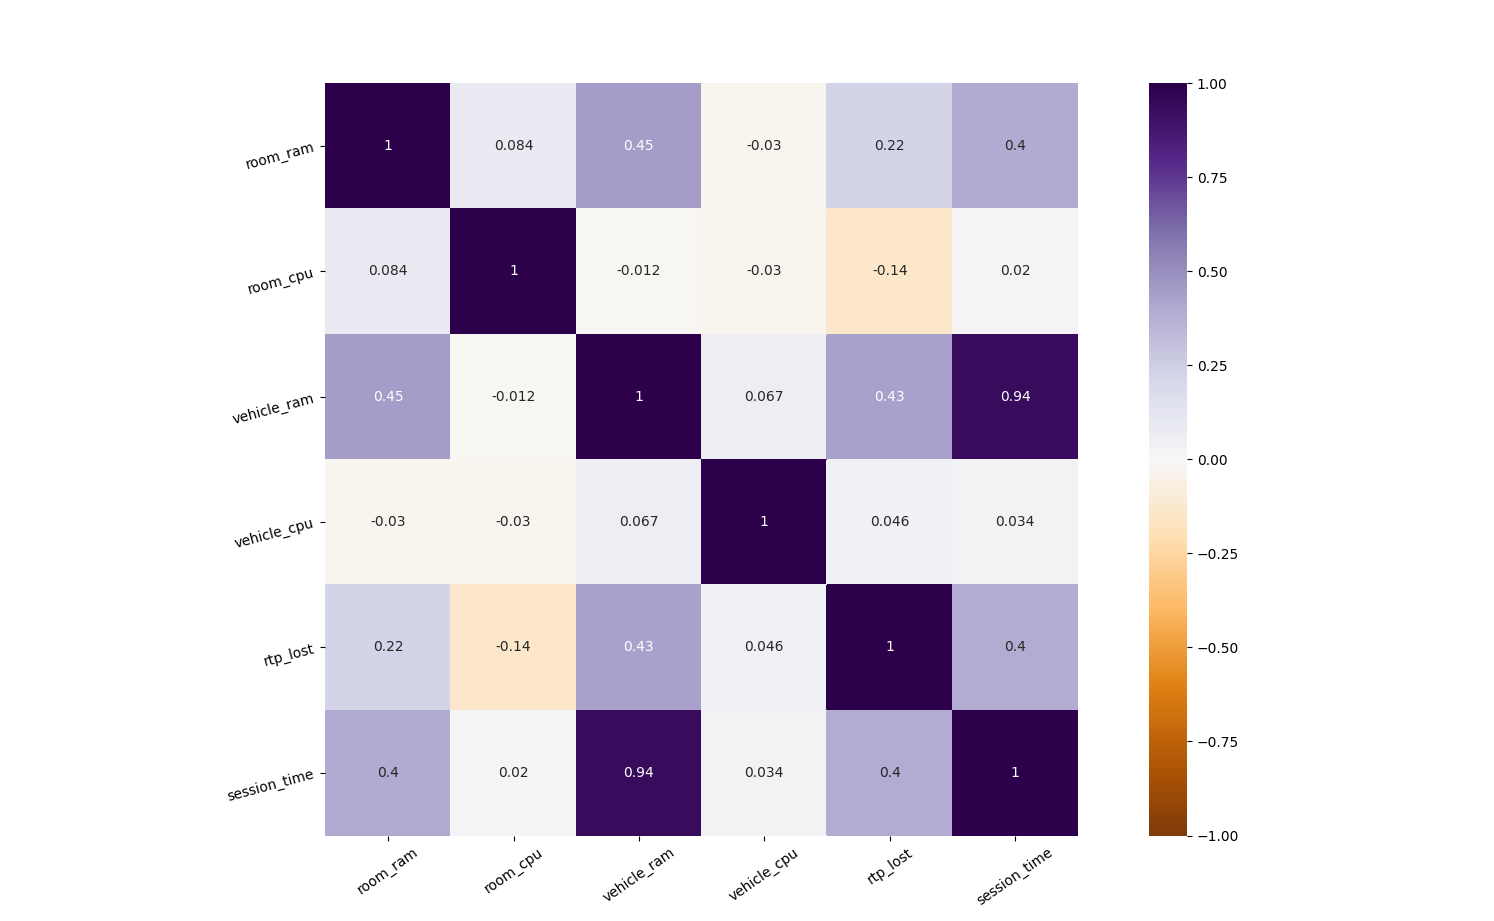 correlation between the
session_time and other features
ram is steadly growing over session_time
but it’s value never gets critical
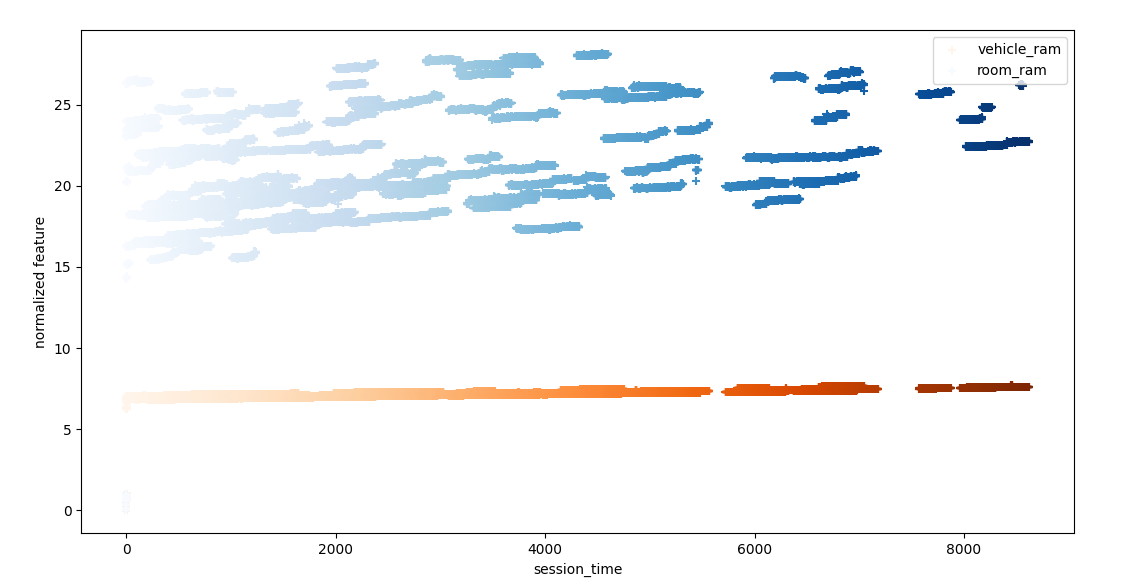 evolution of ram over
session_time
Session time doesn’t seem to influence the number of spikes
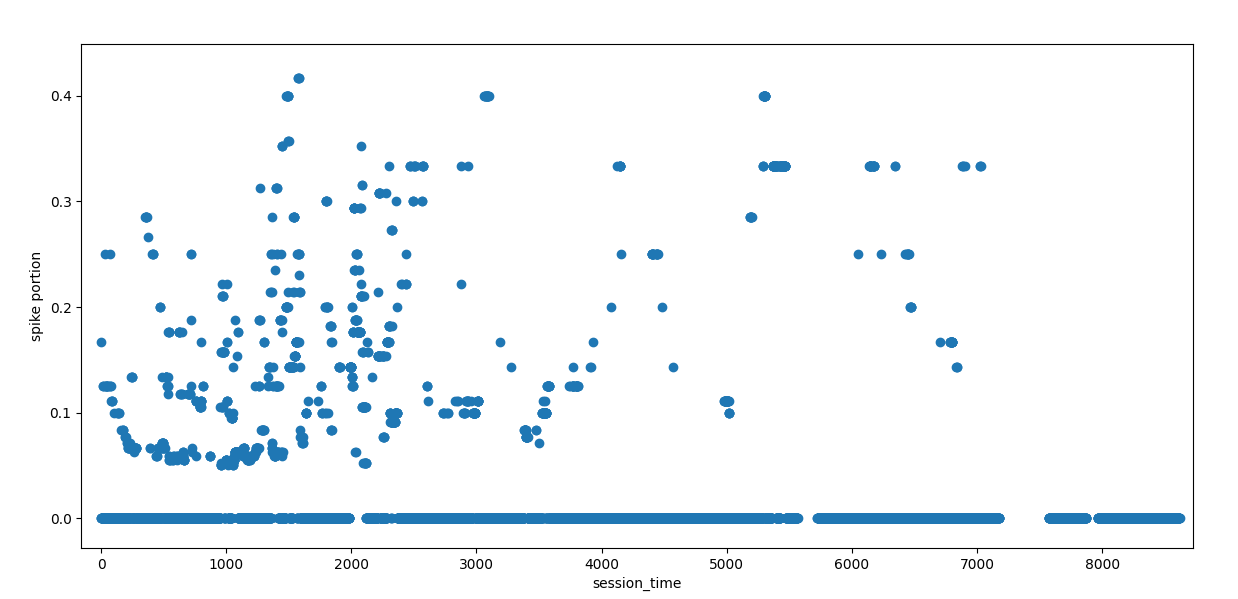 spikes over
 session_time
