Per user we collect a series of events that contain the information about the cell where the user was seen:
We collect an handover between cells per
device (D1-Netz)
We interpret this information defining:
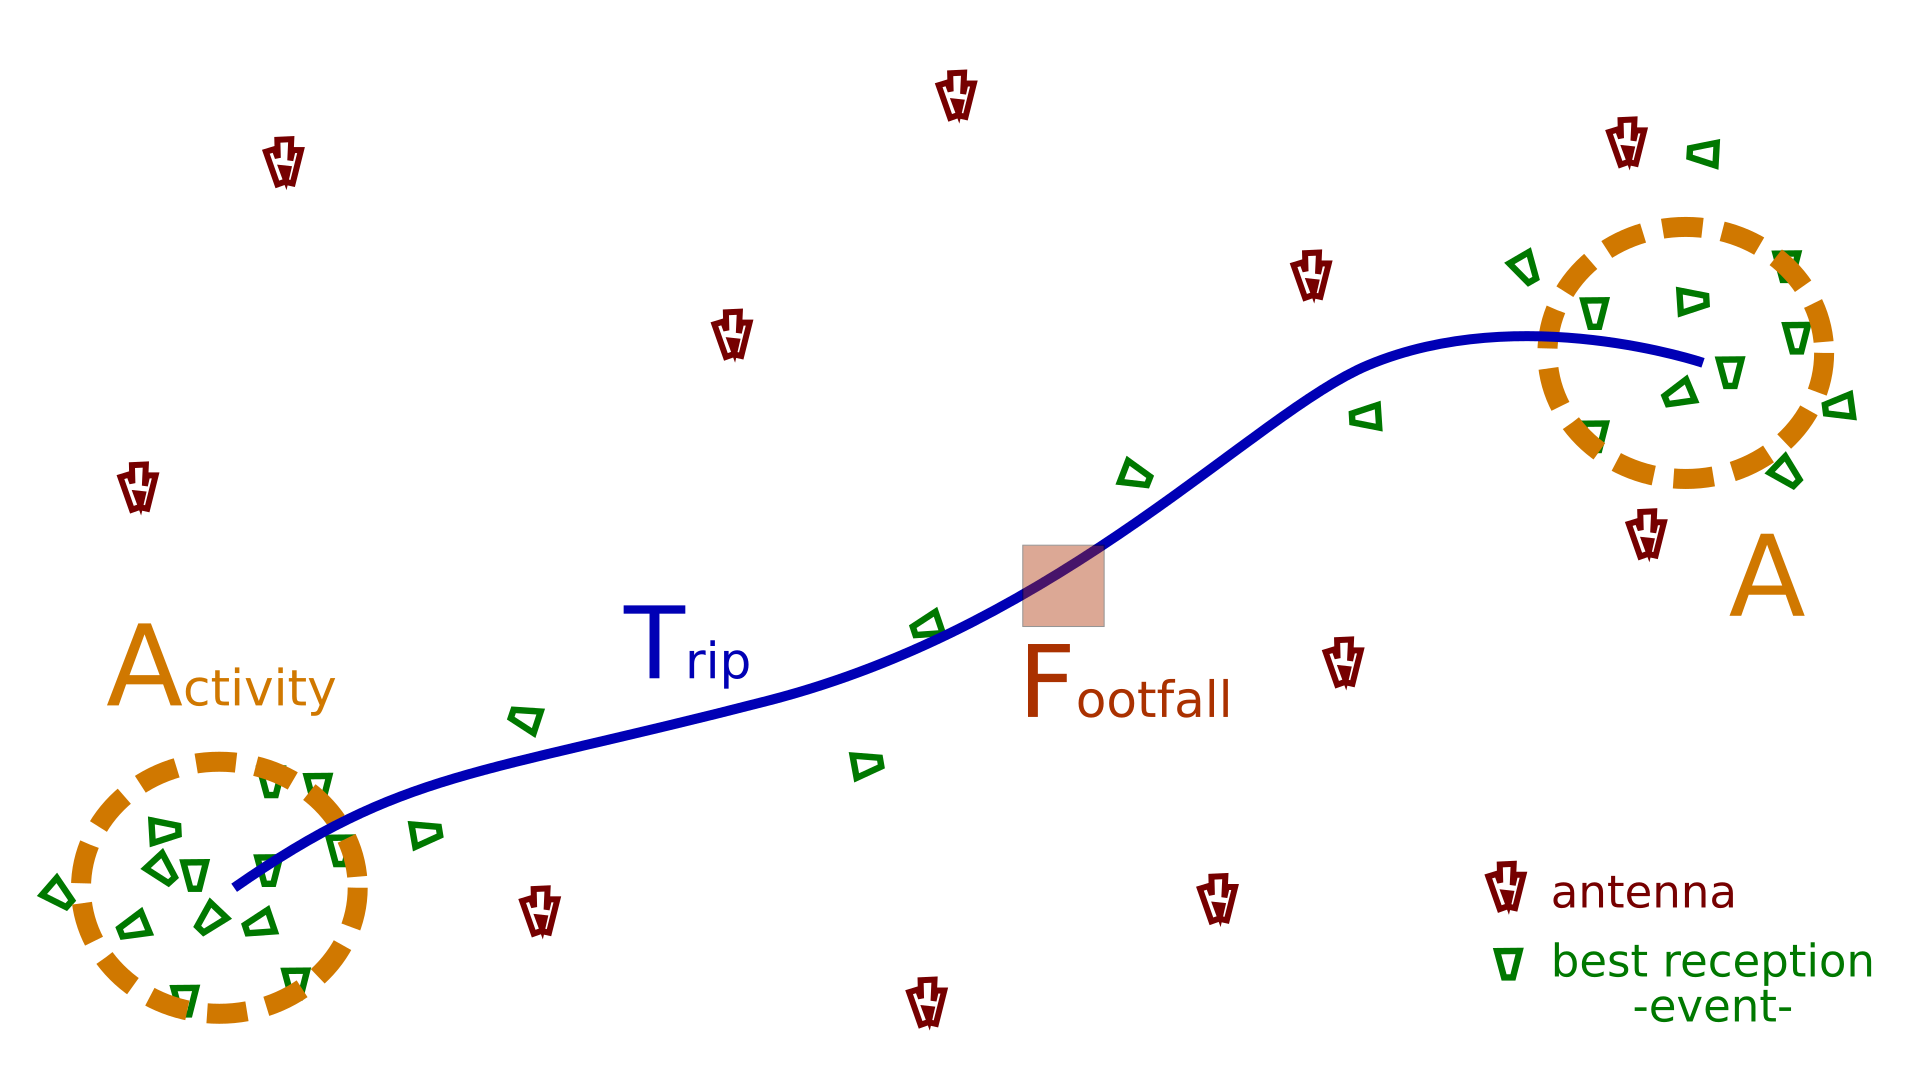 a chain is divided into activities and
trips
We can aggregate the event information with cell specifications which consist in:
Currently an activity is defined flat over the BSE polygon for the most frequent cell inside the events set.
Depending on the particular situation (cell’s position, time of the day, geographical information) we can interpret user’s behaviour.
interpreting users behaviour
We define where an activity took place by calculating the intersection of a zone polygon with the cell’s BSE. We overimpose a geometry on the BSE and we assign the intersection between the two geometries as fraction of activity.
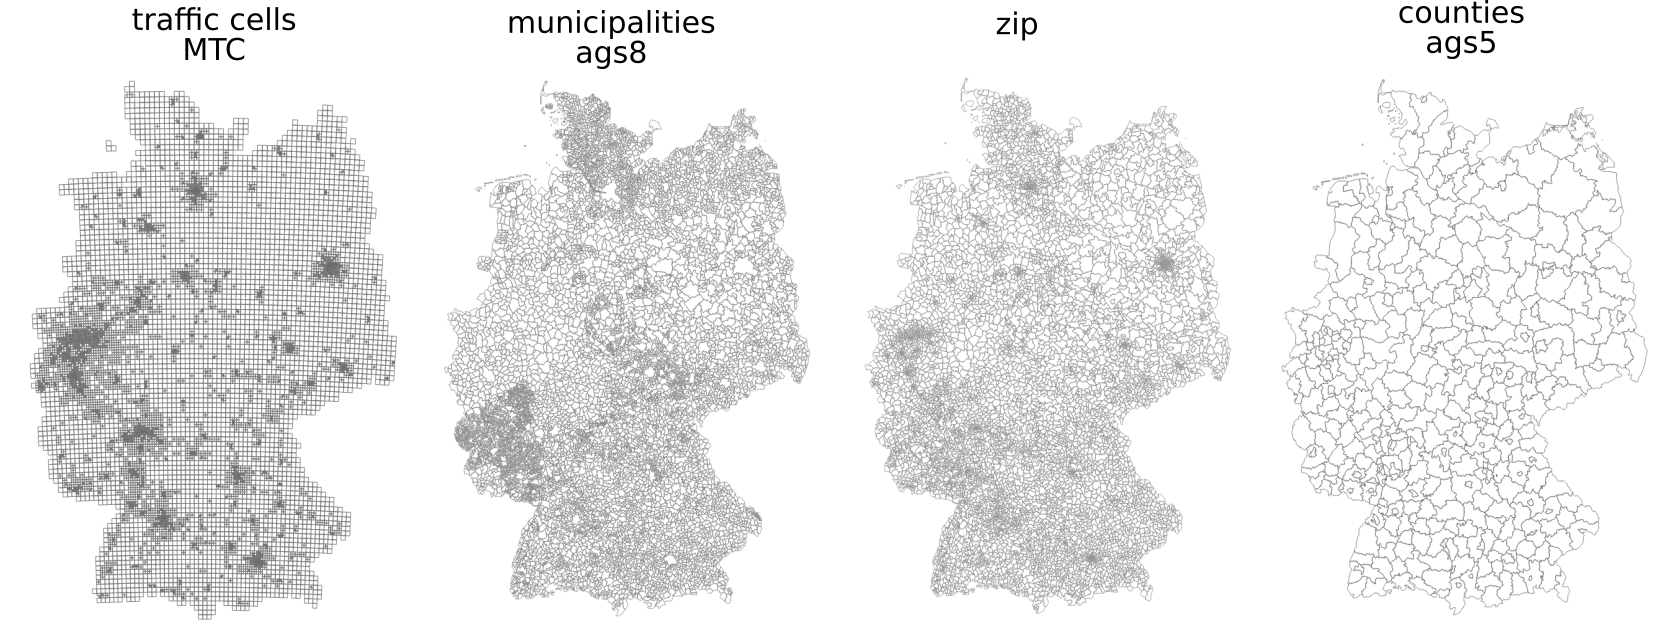 geometries used to calculated
activities
All the mentioned geometries are available to download
We write hour 14 meaning all the activities between 13 and 14.
example of time mappings
We have to convert the time zone depending on the legal time time zone converter.
 different conversions between summer and
winter time
The statistical week is a collection of statistical days which consists in a series holiday free days grouped by weekday type.
The first consistency check is done visualizing the data 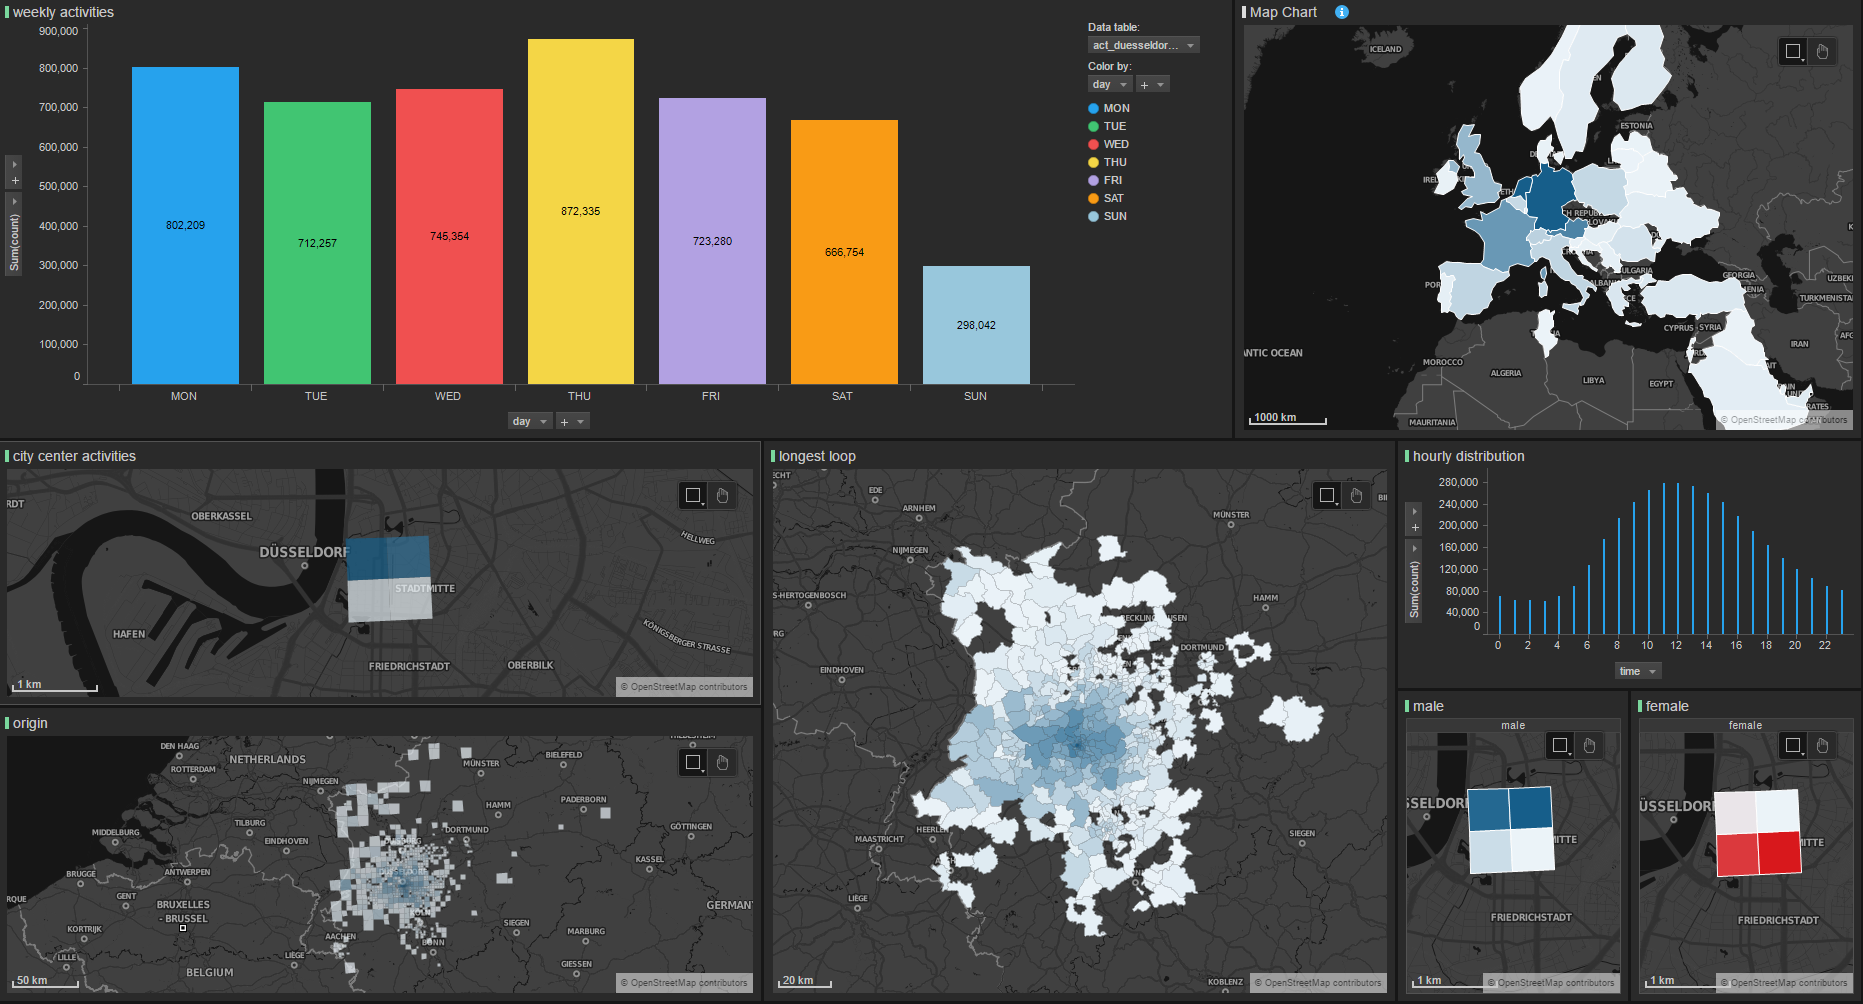 statWeek duesseldor../f/f
An ODM is an origin-destination matrix where we consider every single trip to create an origin-destination relationship.
We compare people behavior with different statistics.
München suburbs many people travel to München to work.
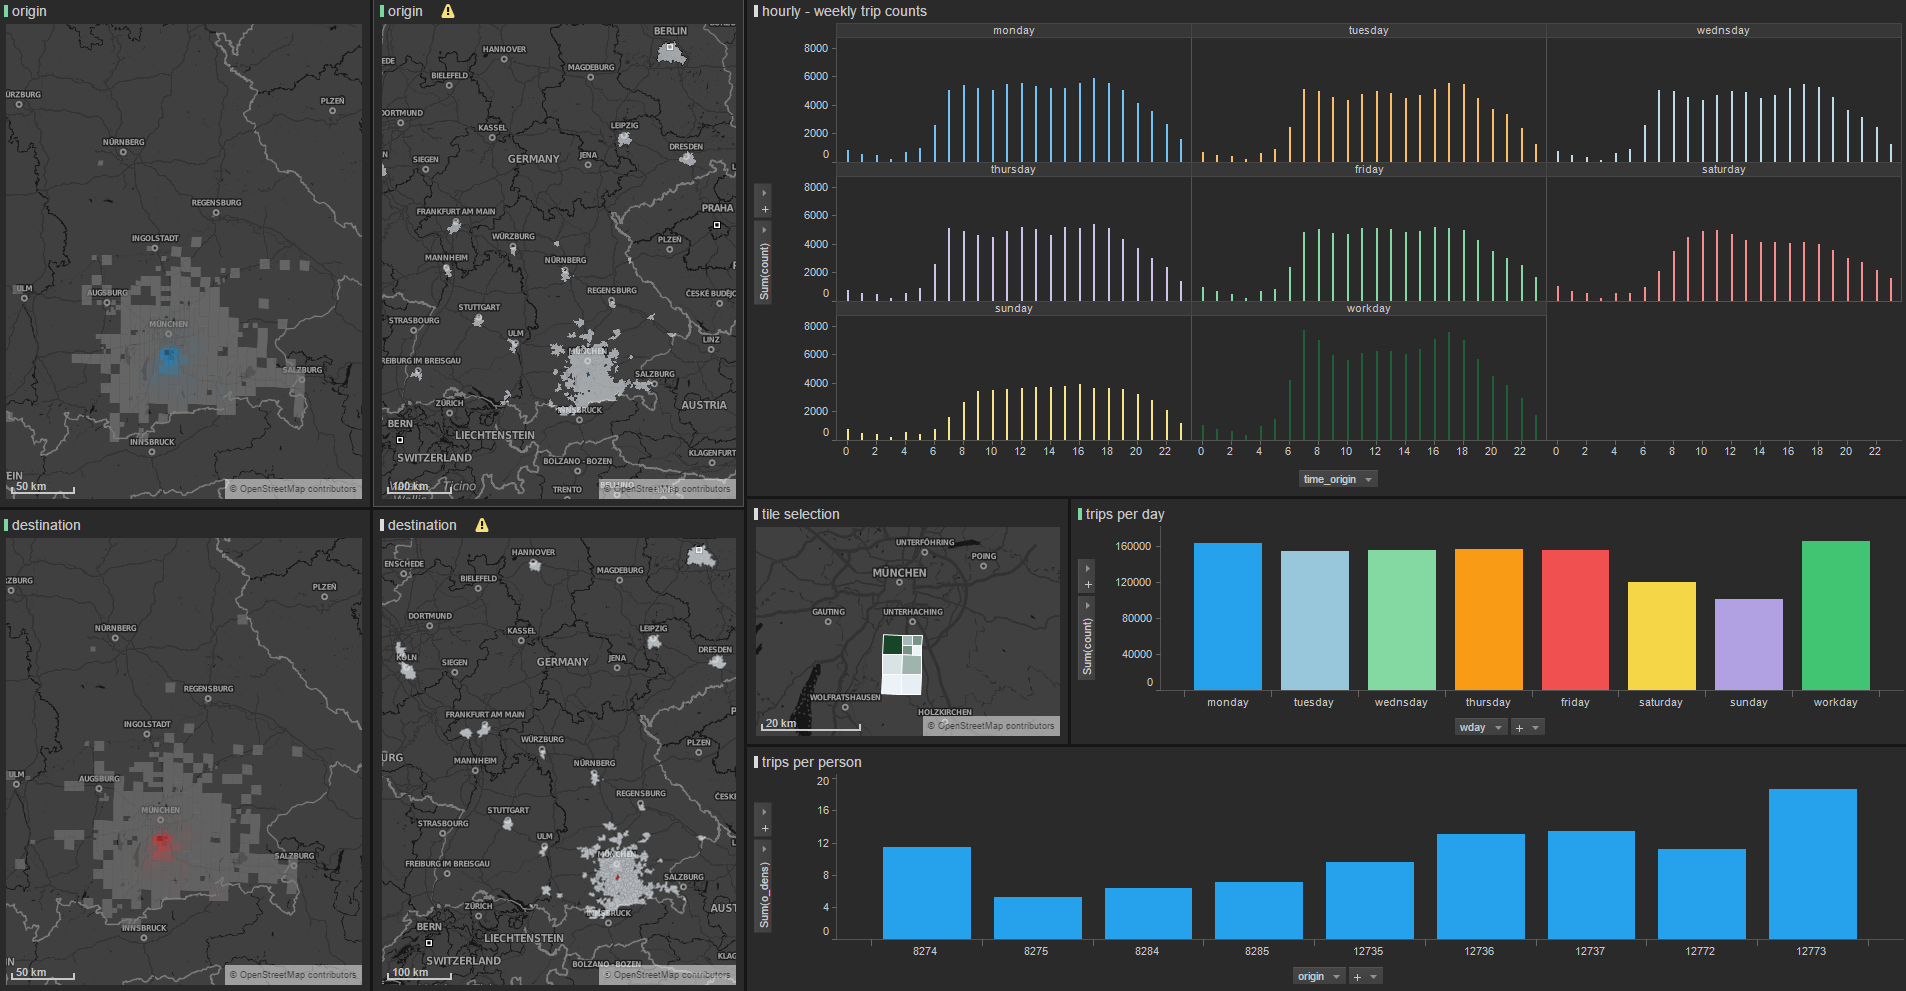 statWeek
odm for oberhaching
In Stuttgart there is a clear pattern of commuters during the day.
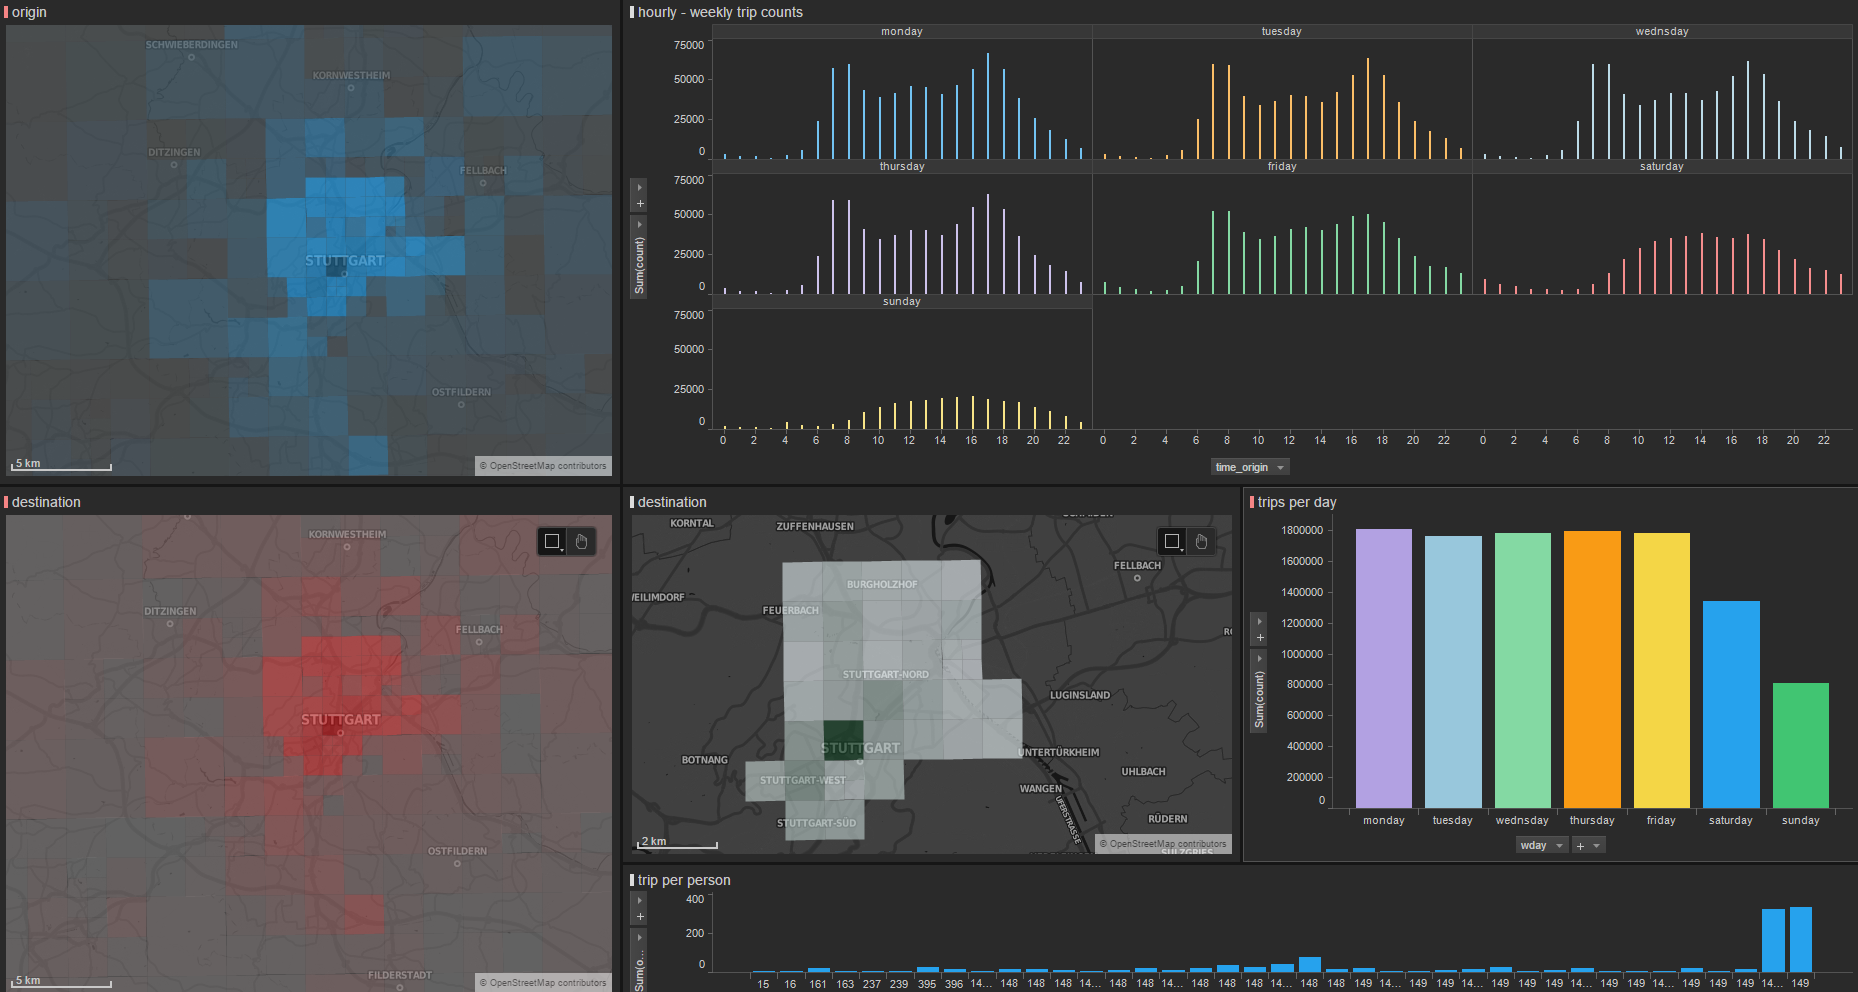 statWeek odm
for stuttgart
Hannover has a lower dense neighborhood, people travel less.
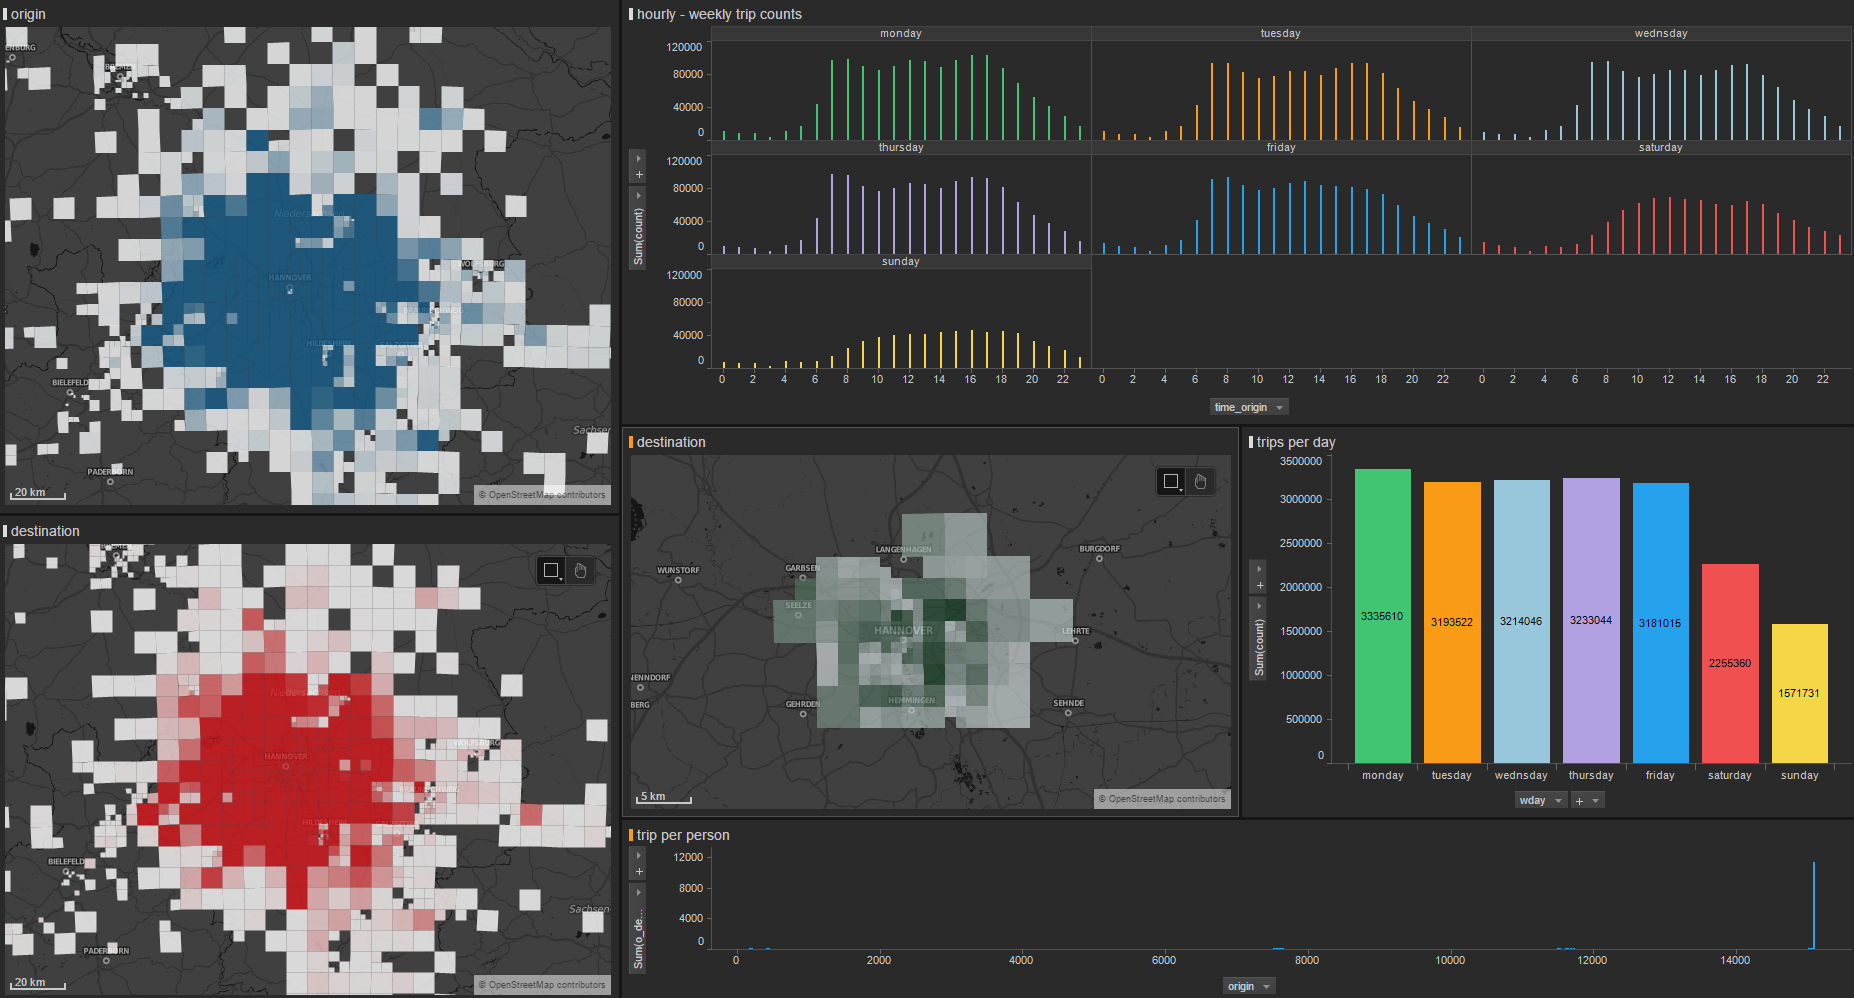 statWeek odm
for hannover
Berlin is harder to interpret.
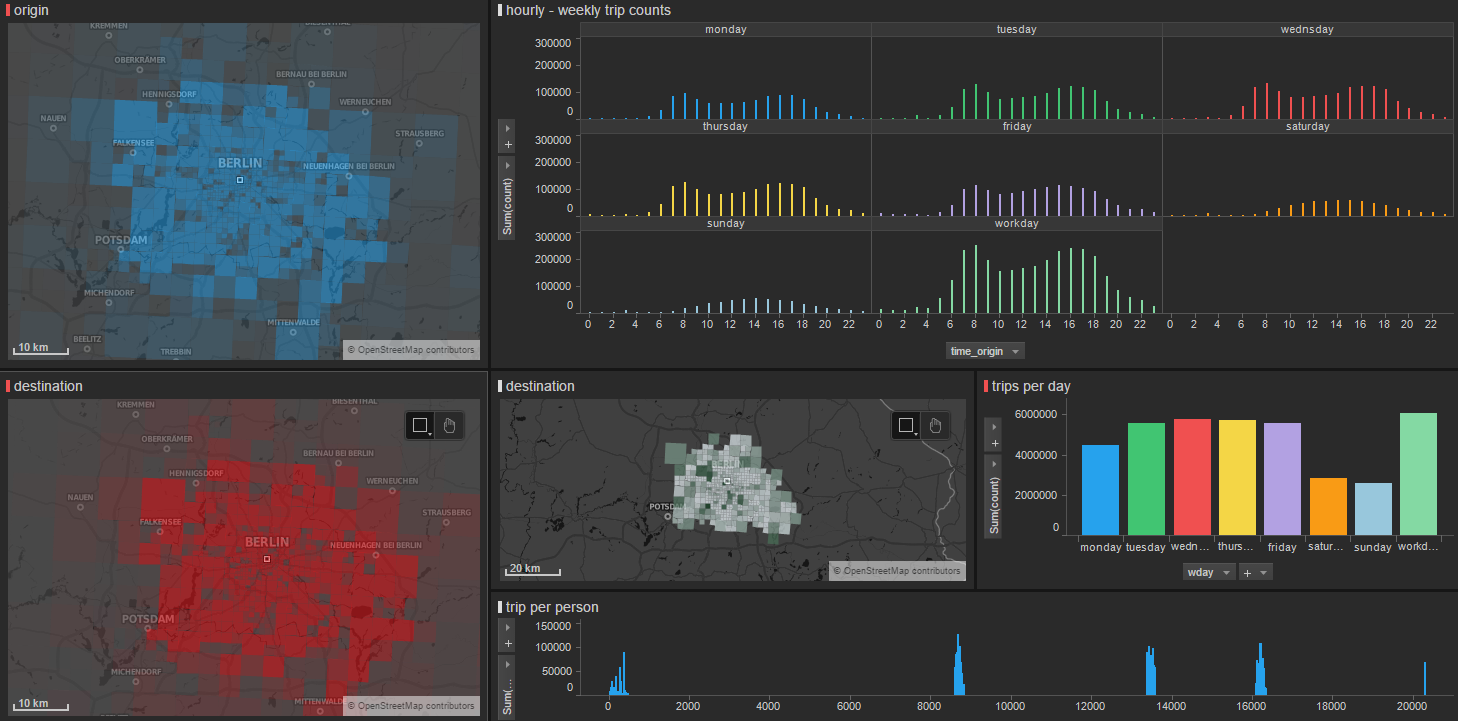 statWeek odm for berlin
The most important quantities to consider are:
Nodes can be verified on openstreetmap
Building an overpass query returns all the nodes and ways returning the same label
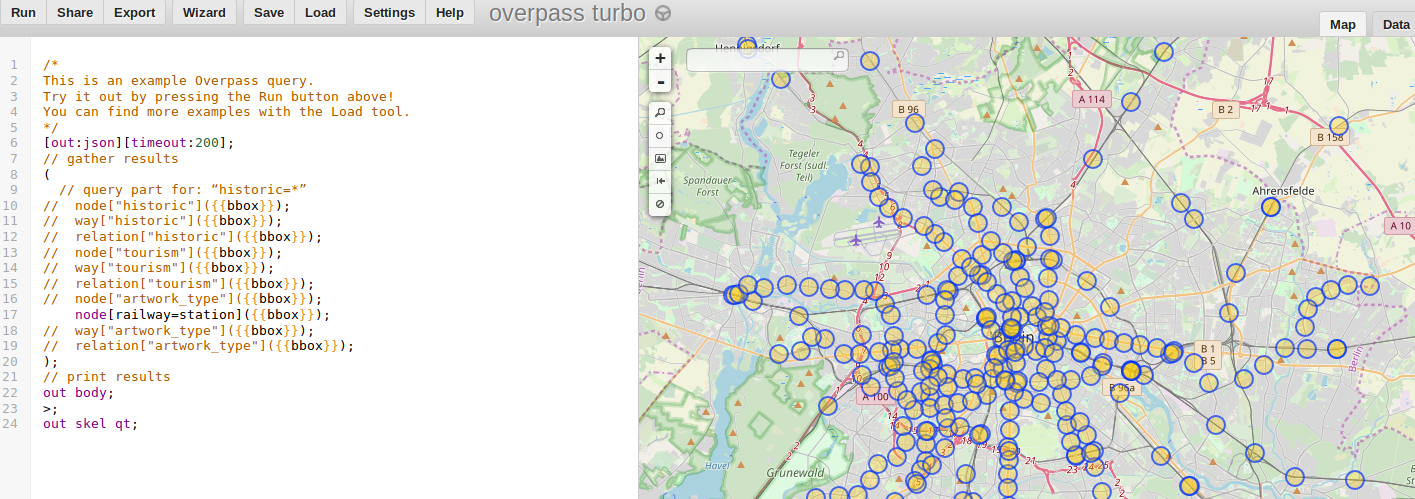 overpass query
We build a network for routing all trips into trajectories.
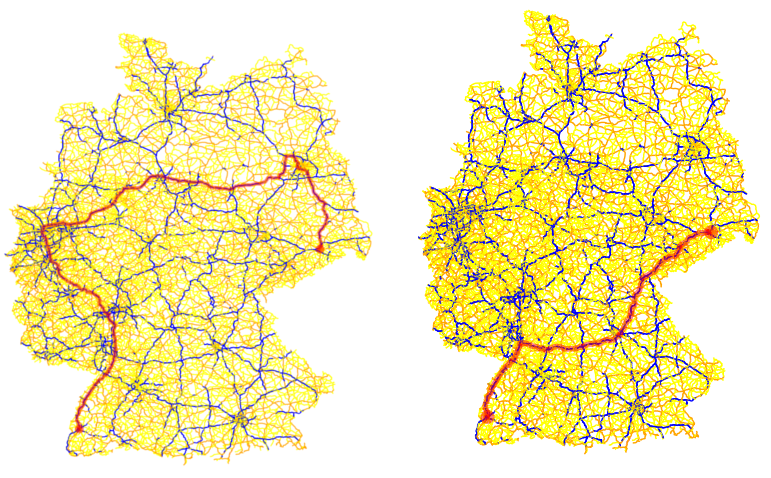 routing,
improve in weighting
and we take into account all the events to calculate the best trip.
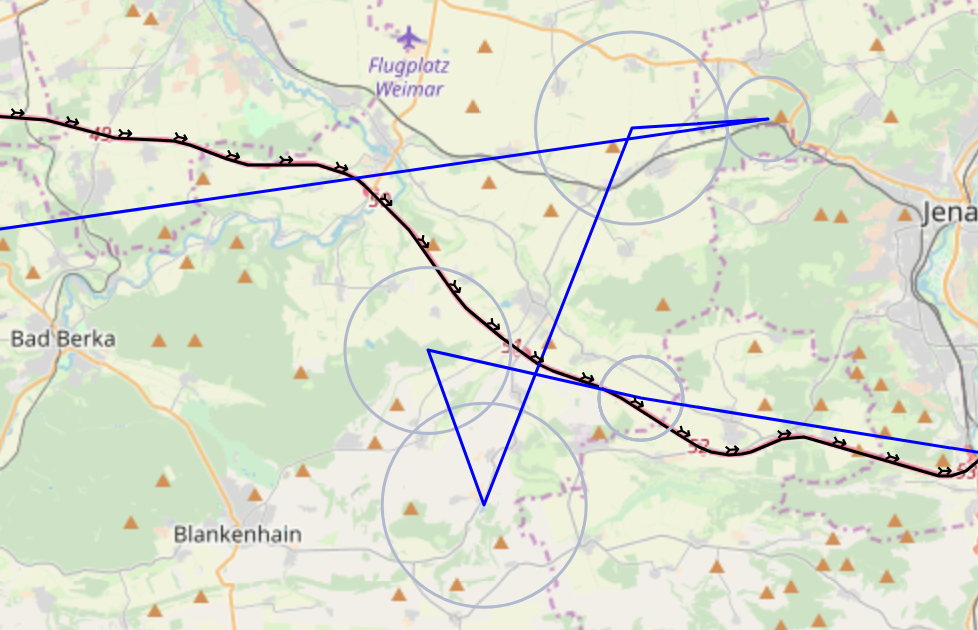 detour avoided discarding neighboring
events
We count than the number of trajectories for the nodes contained in the tile and obtain the footfalls.
From each tile we collect the information and we apply it to the
geometry under study 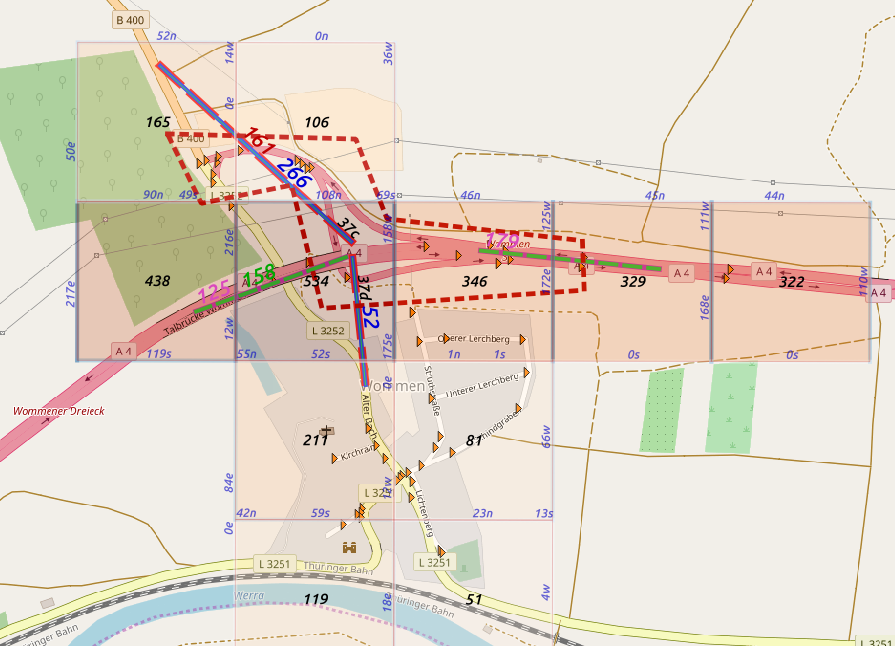 edge count
Data can be collected via API
Usual header and credential:
headers = {"Content-type":"application/x-www-form-urlencoded; charset=UTF-8","Authorization":"OAuth2"}
baseUrl = cred['api-url']+":"+str(cred['api-port'])
List of features
optL = {"debug":"debug=true","mtc":"geoType=mtc","days":"aggregation=days"}
repL = {"hello":"/tools/hello","dates":"/tools/availableDates"
        ,"login":"/v1/auth/login"
        ,"location":"/v1/locations/"
        ,"tiles":"/v1/tiles/location/"
        ,"counts":"/v1/reports/counts/overall/location/"
        ,"direction":"/v1/reports/directions/overall/location/"
        ,"odm":"/v1/reports/odm/counts/location/"
        ,"geometry":"/v1/tools/geometries/geoType/mtc?shapeIds=777,789"
        ,"overnight":"/v1/reports/overnight/overall/location/"
        ,"tourist":"/v1/reports/tourists/overall/location/"
}
Collecting available dates:
resq = requests.get(baseUrl+repL['dates']+authP,headers=headers,verify=False)We loop over all locations to obtain the specific location information:
for i in range(locL.shape[0]):
    print('processing: ' + str(i))#,end="\r")
    getU = baseUrl + repL['direction'] + str(locL['locationId'].iloc[i]) + "/from/" + str(datem) + "/to/" + str(dateM) + authP
    resq = requests.get(getU,headers=headers,verify=False)