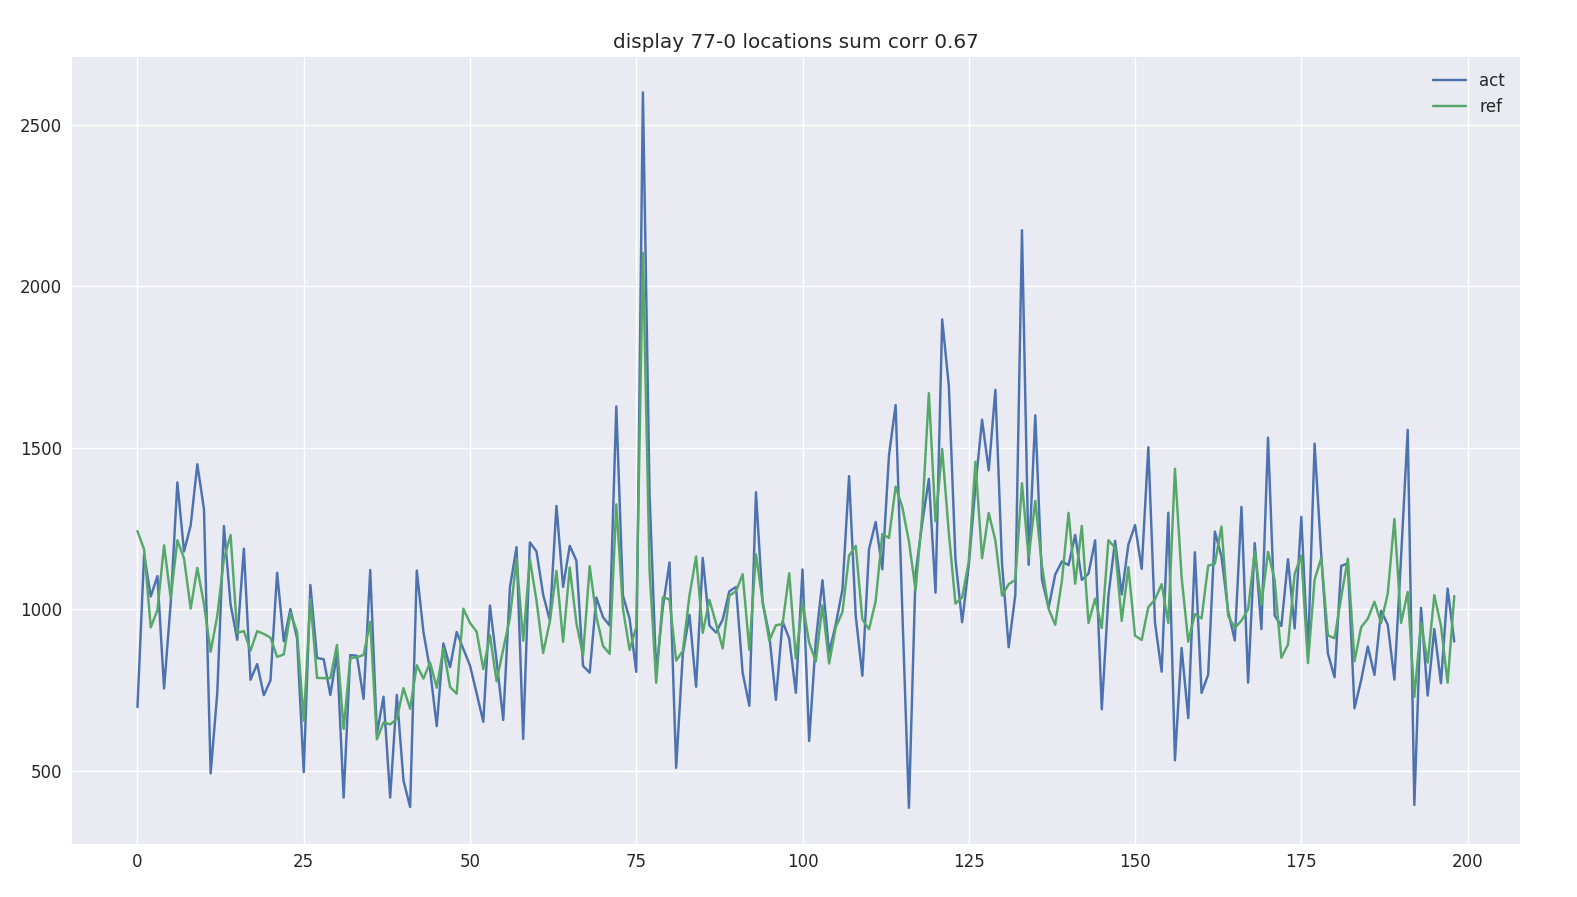
 reference vs reference + gaussian noise, a single
location might have low correlation
reference vs reference + gaussian noise, a single
location might have low correlationOur function can be expressed as:
xact(t)mshare(td) = yref(t)../f/fpeople(t) + yout(t)
where xact is the number of activities, mshare is the market share, yref reference data - cachier receipts, ../f/fpeople people per receipt, yout people outside the shop, t time, td day
To check the capability of the prediction we take as reference the customer data and as activities the customer data multiplied by a random noise
 reference vs reference + gaussian noise, a single
location might have low correlation
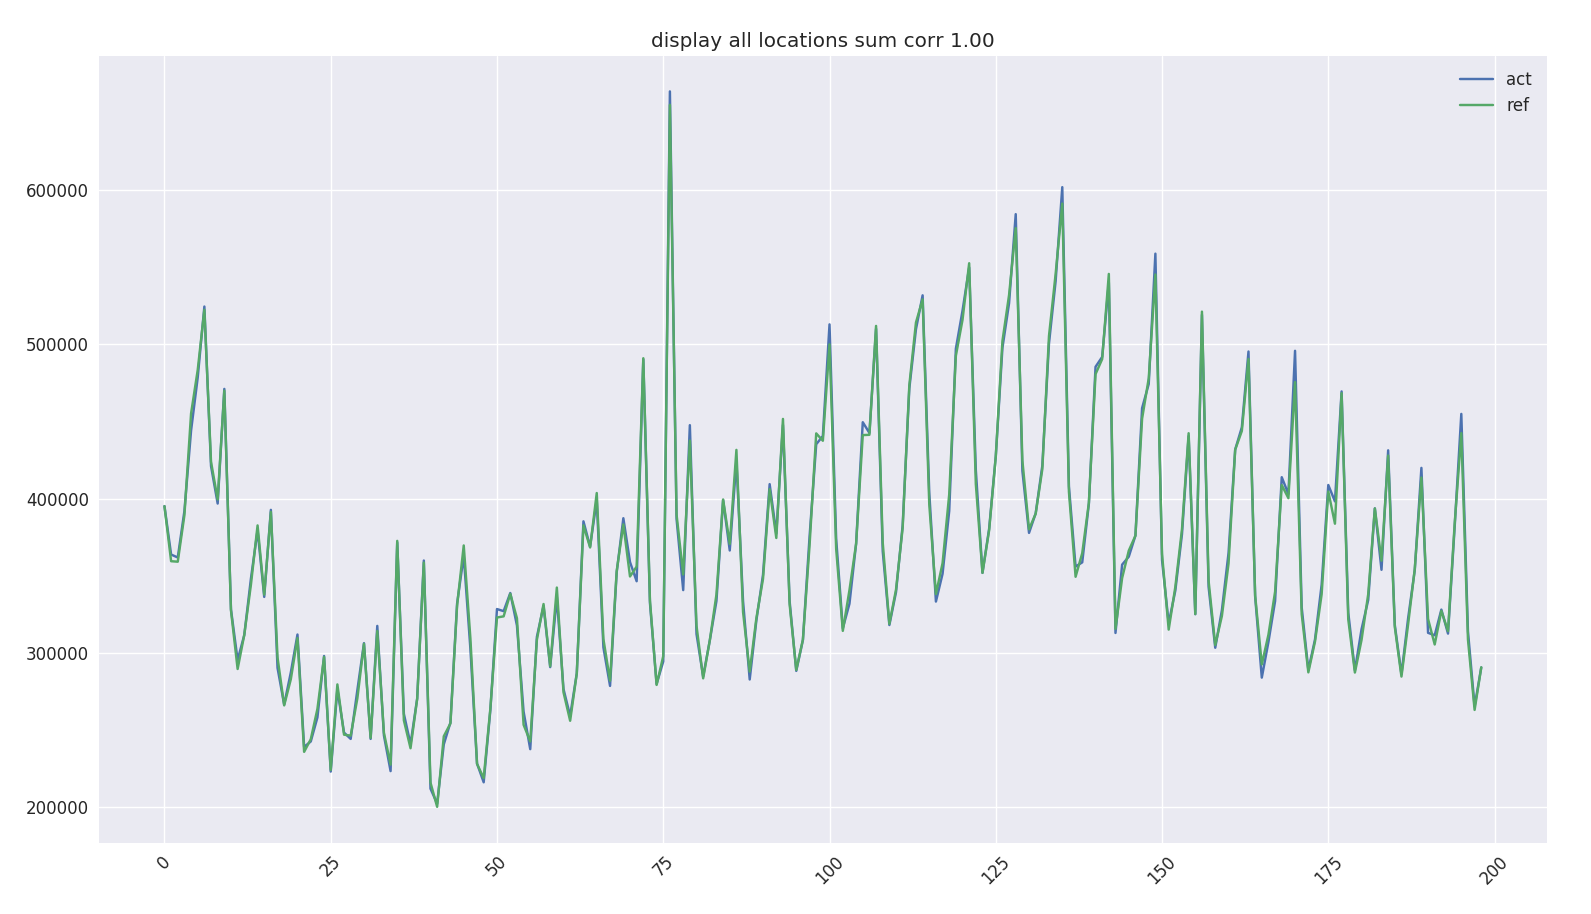 reference vs
reference + gaussian noise, overall sum neutralizes the gaussian
noise
 score gauss noise 50%
 score gauss noise 90% no smoothing, final score on 30
days
 score gauss noise
30%, final score on june
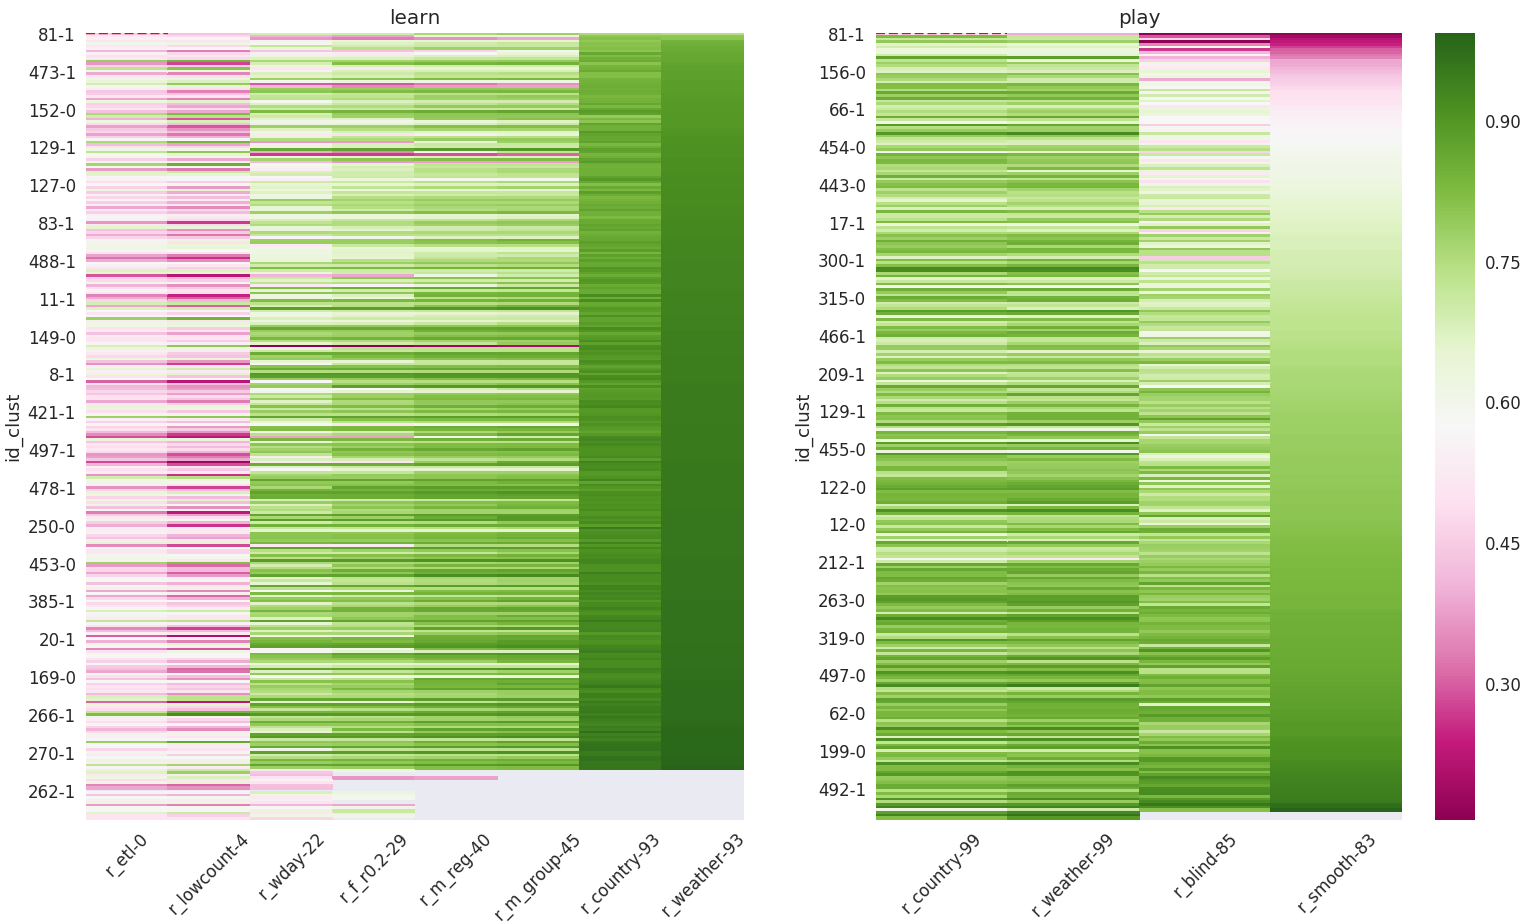 score gauss noise
20%, final score on june
We take the first 20 cilacs close to a poi and we calculate activites on daily basis.
Activities are processed with a 20km previous distance filter and we match activity chirality with the poi chirality.
6% of the total cilacs correlates over 0.6 with reference data.
The sum of the activities over all country is
 no day filtering
We have to filter out bad days
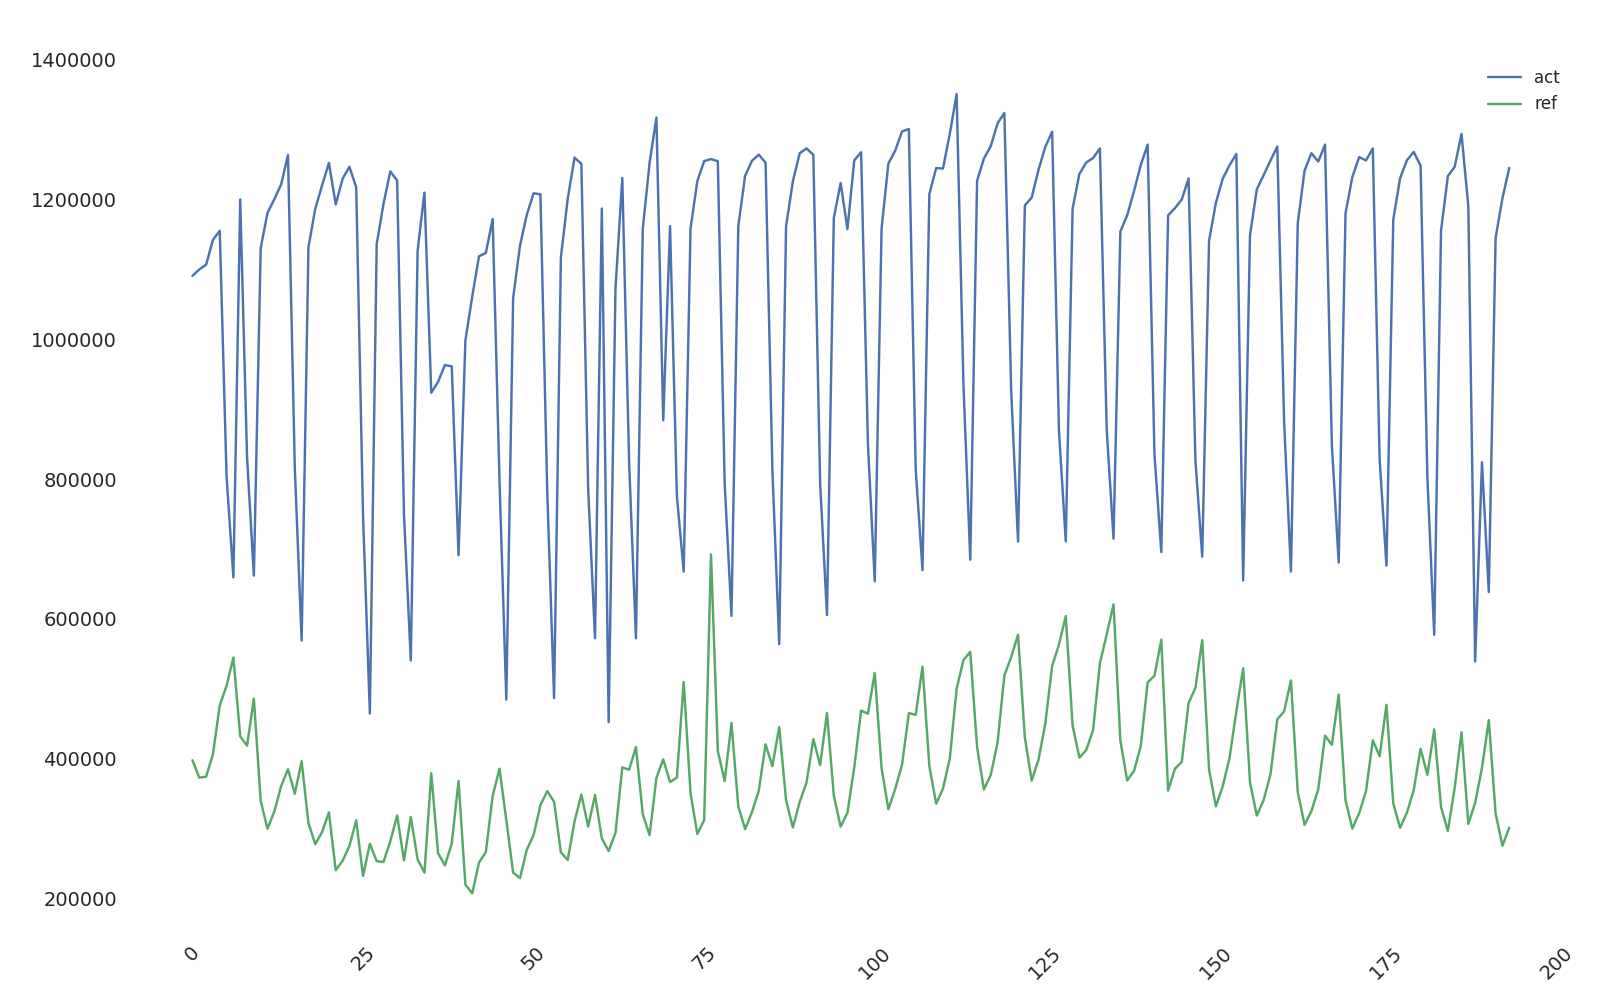 bad day filtering
We perform a weekday correction
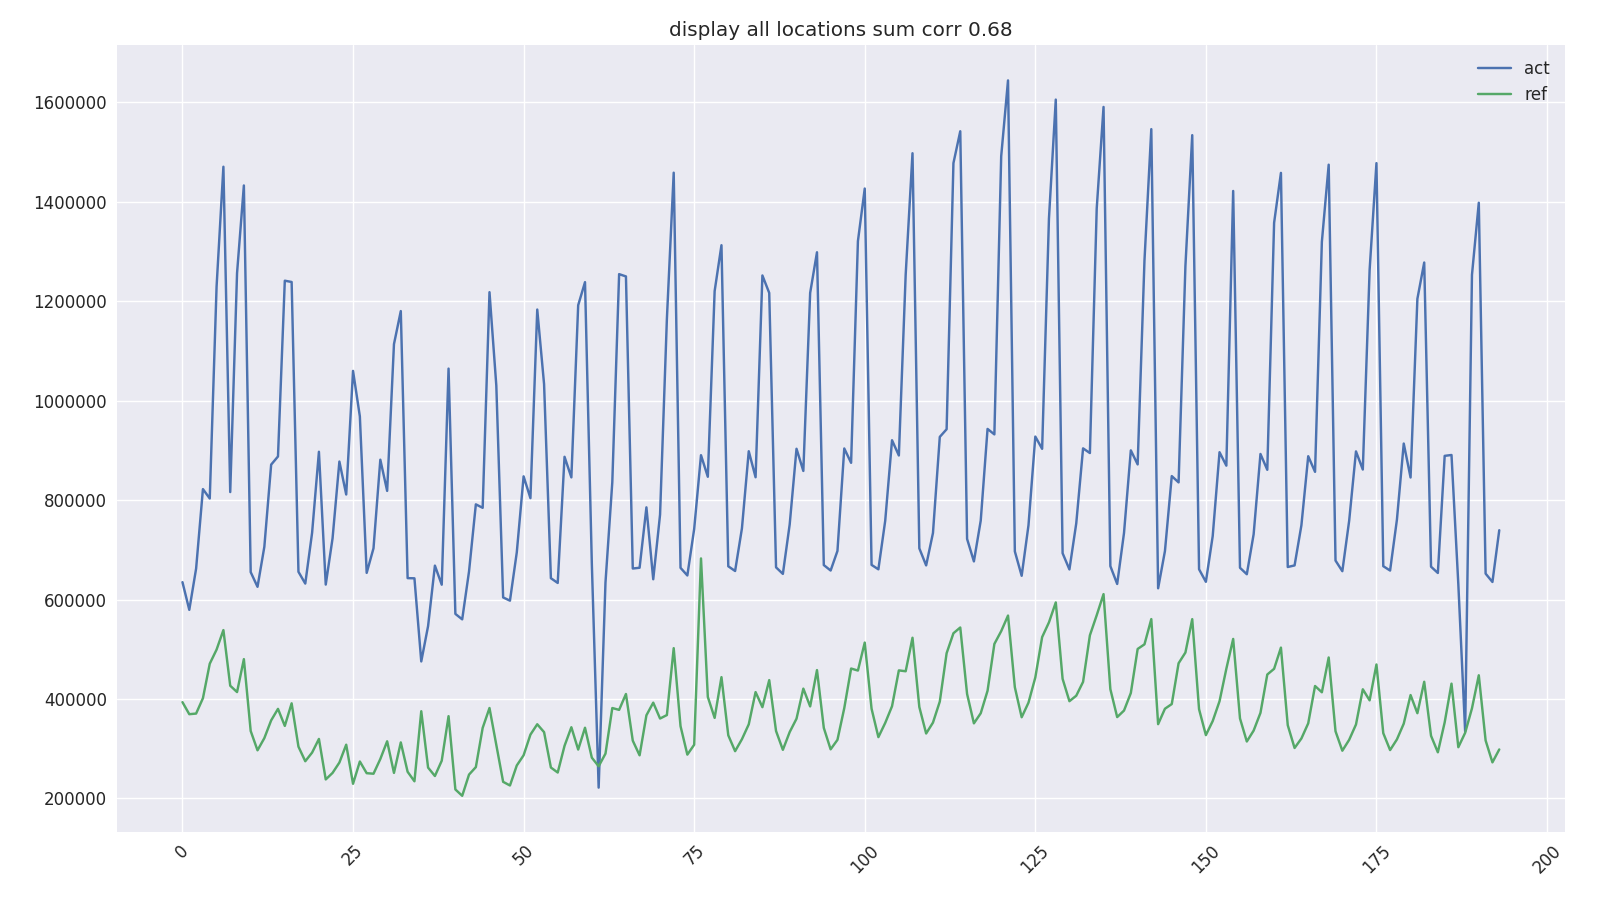 weekday correction
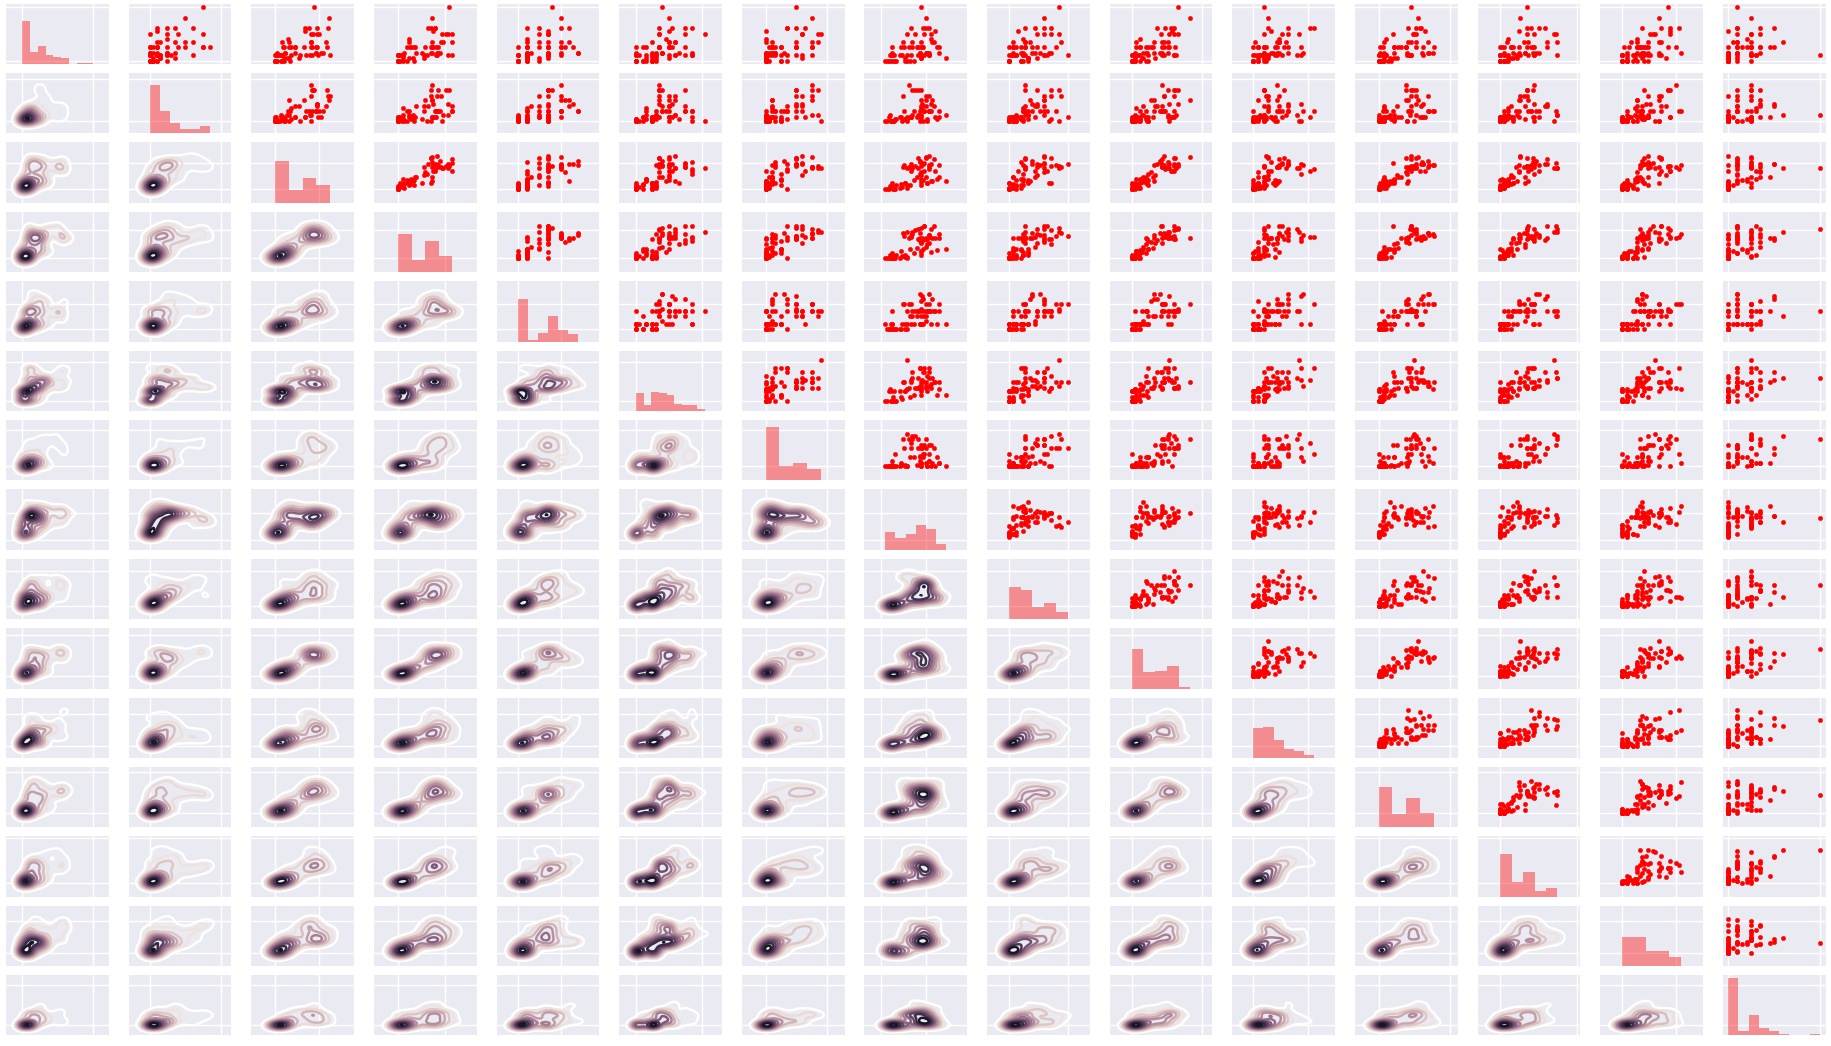 2d correlation between cilac patterns
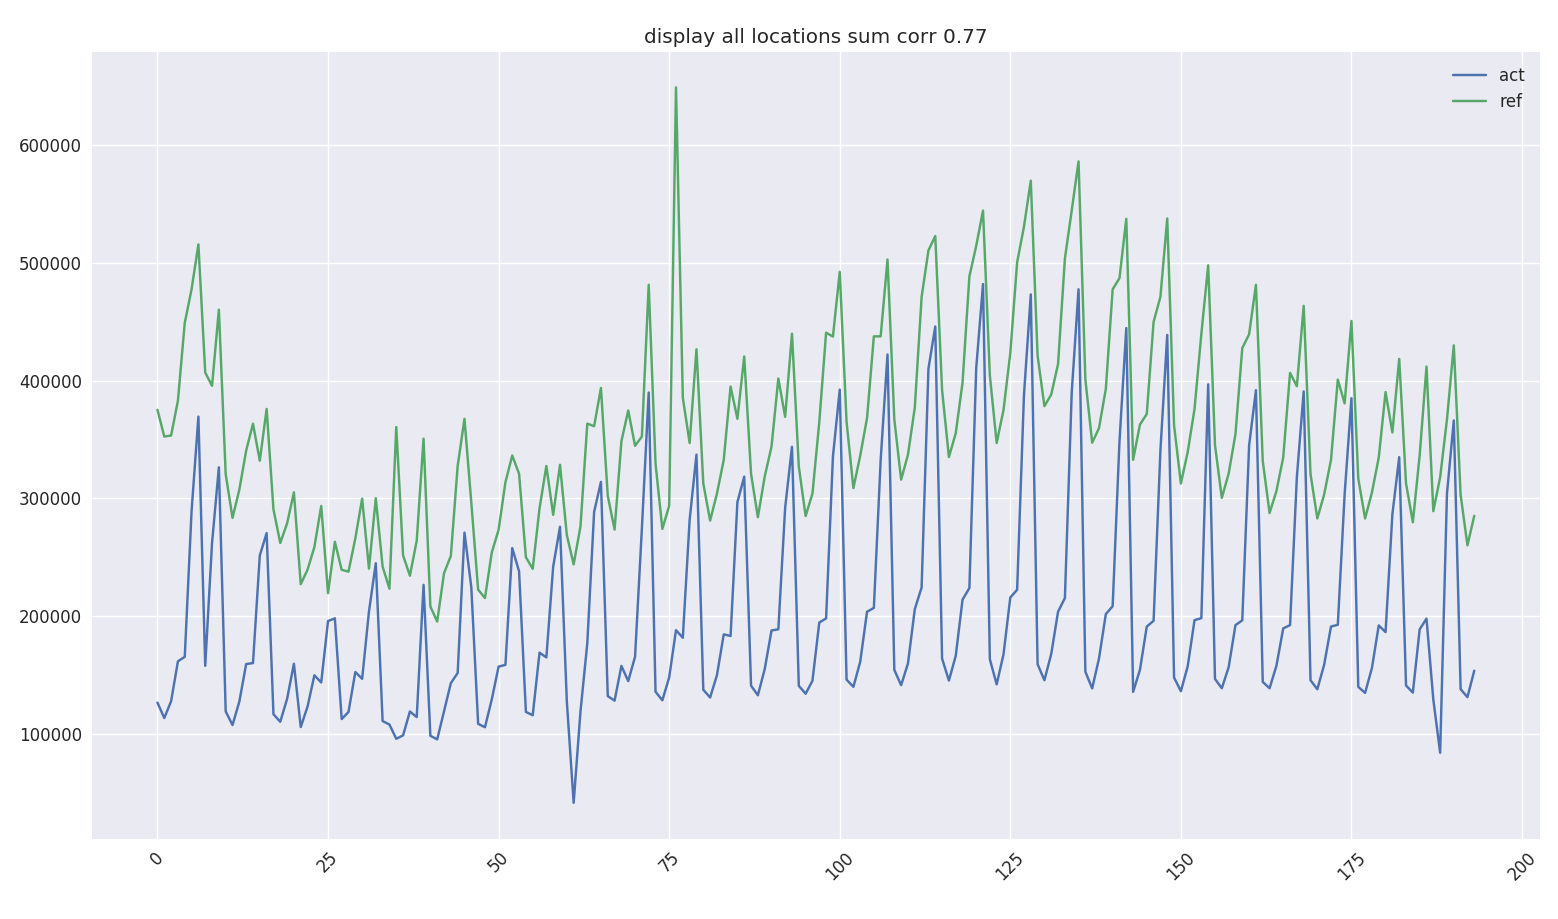 country
adjustment
etl - lowcount - wday - filter - reg 00 - 04 - 22 - 30 - 41
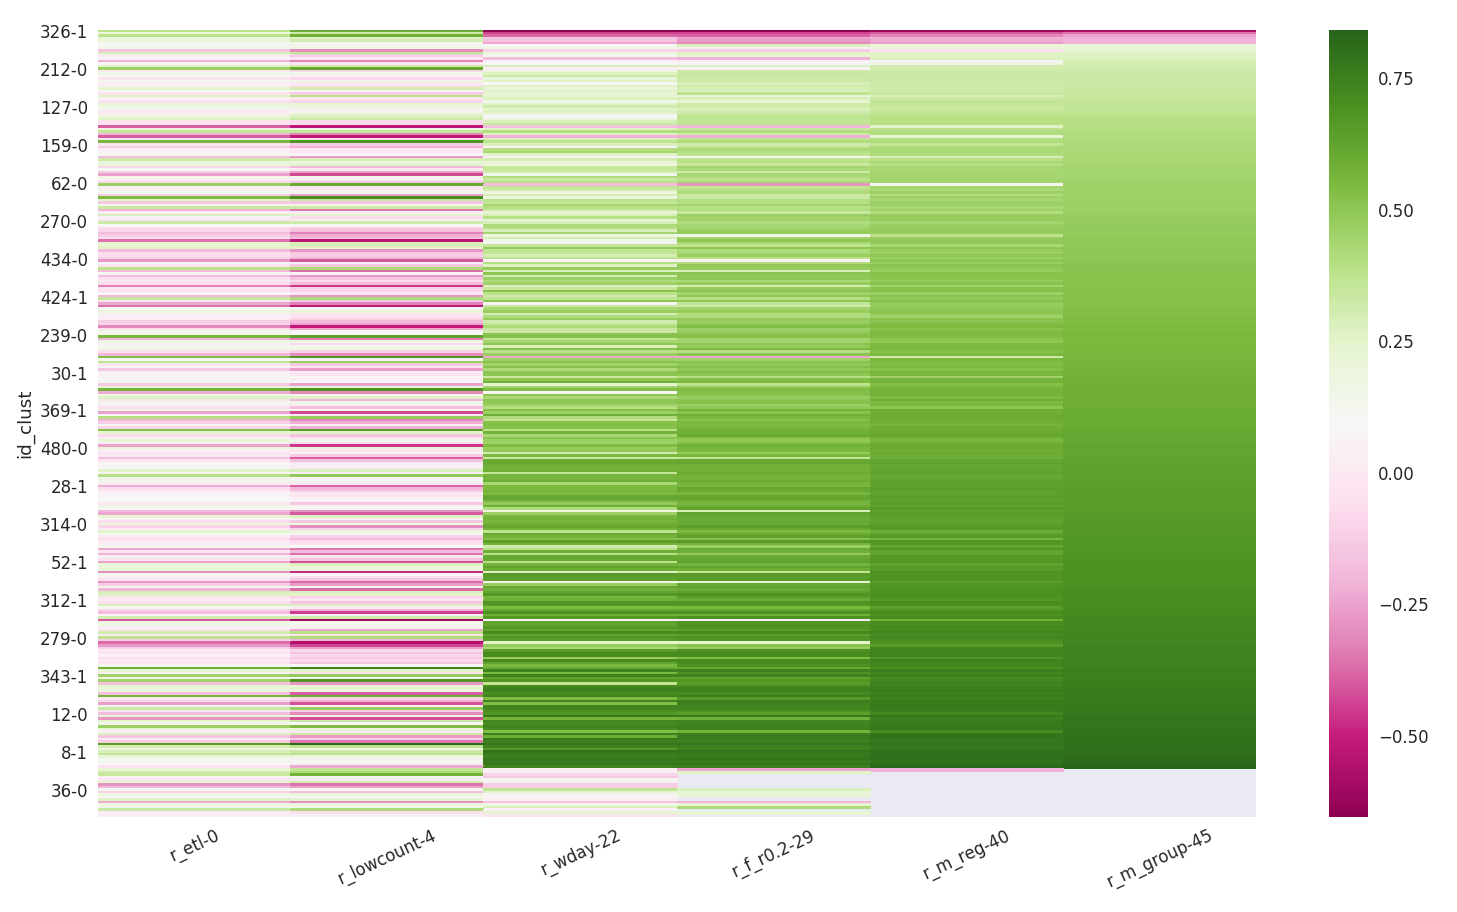 iteration of
the new mapping scoring
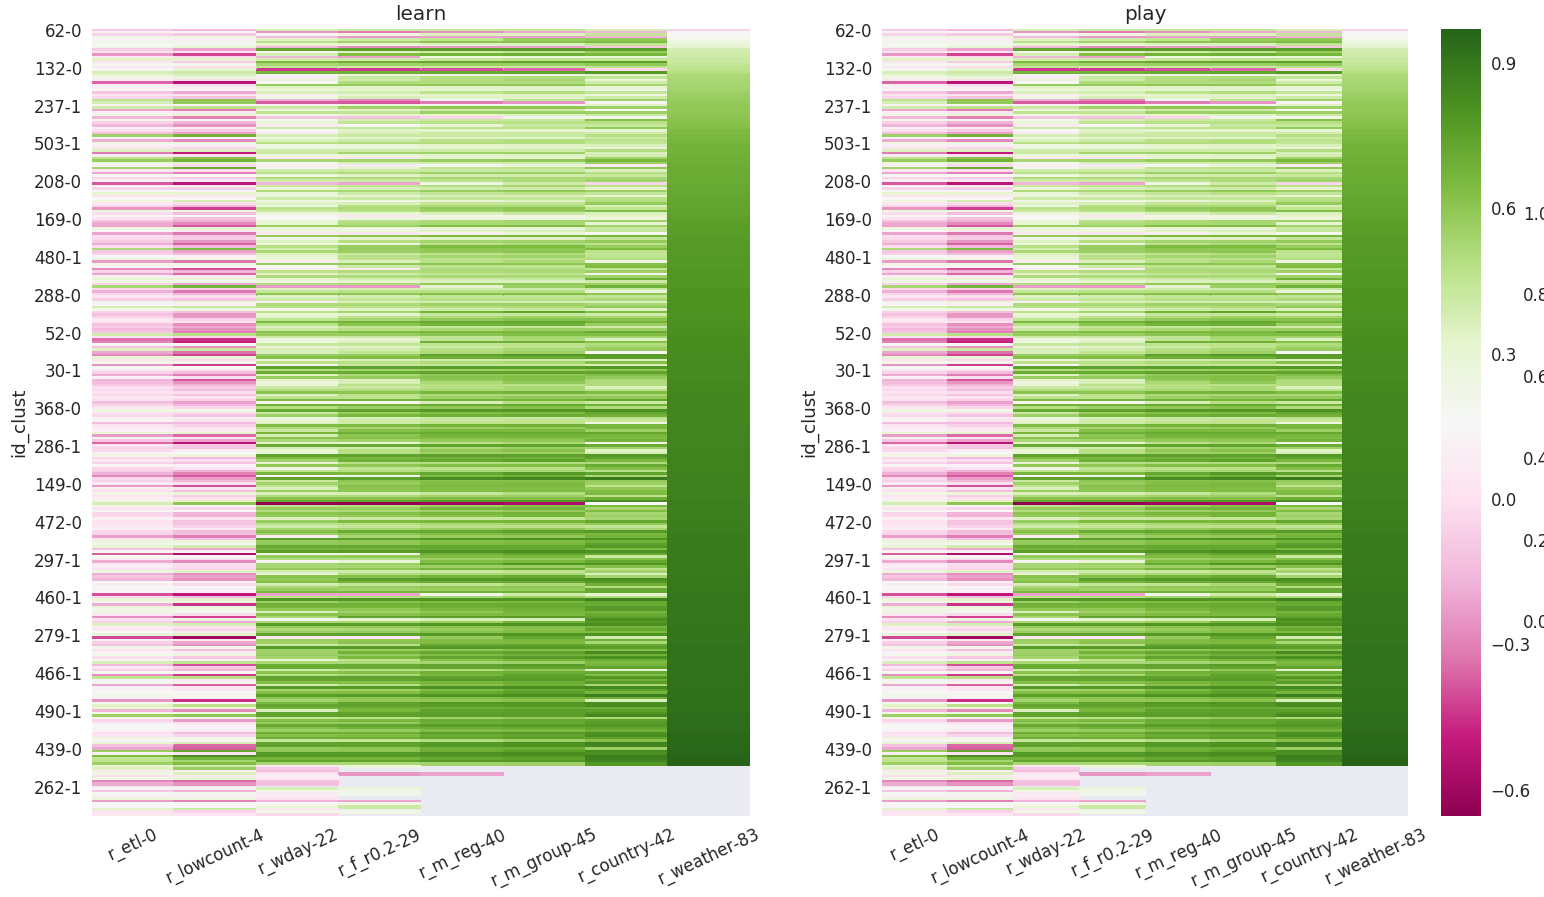 test on performance on learn & play on
same days
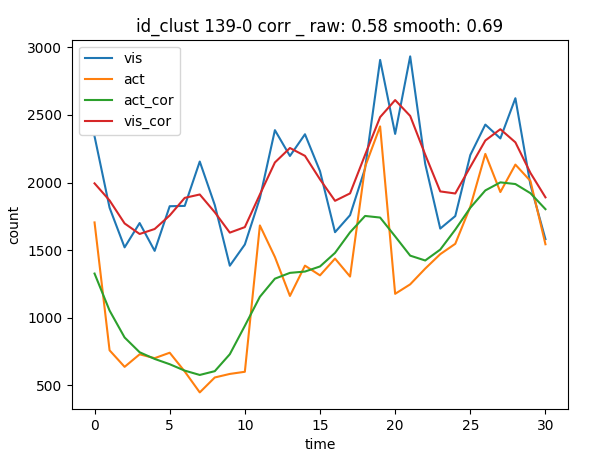 smoothing
correlates neighboring events and improves the score, june in blind
test
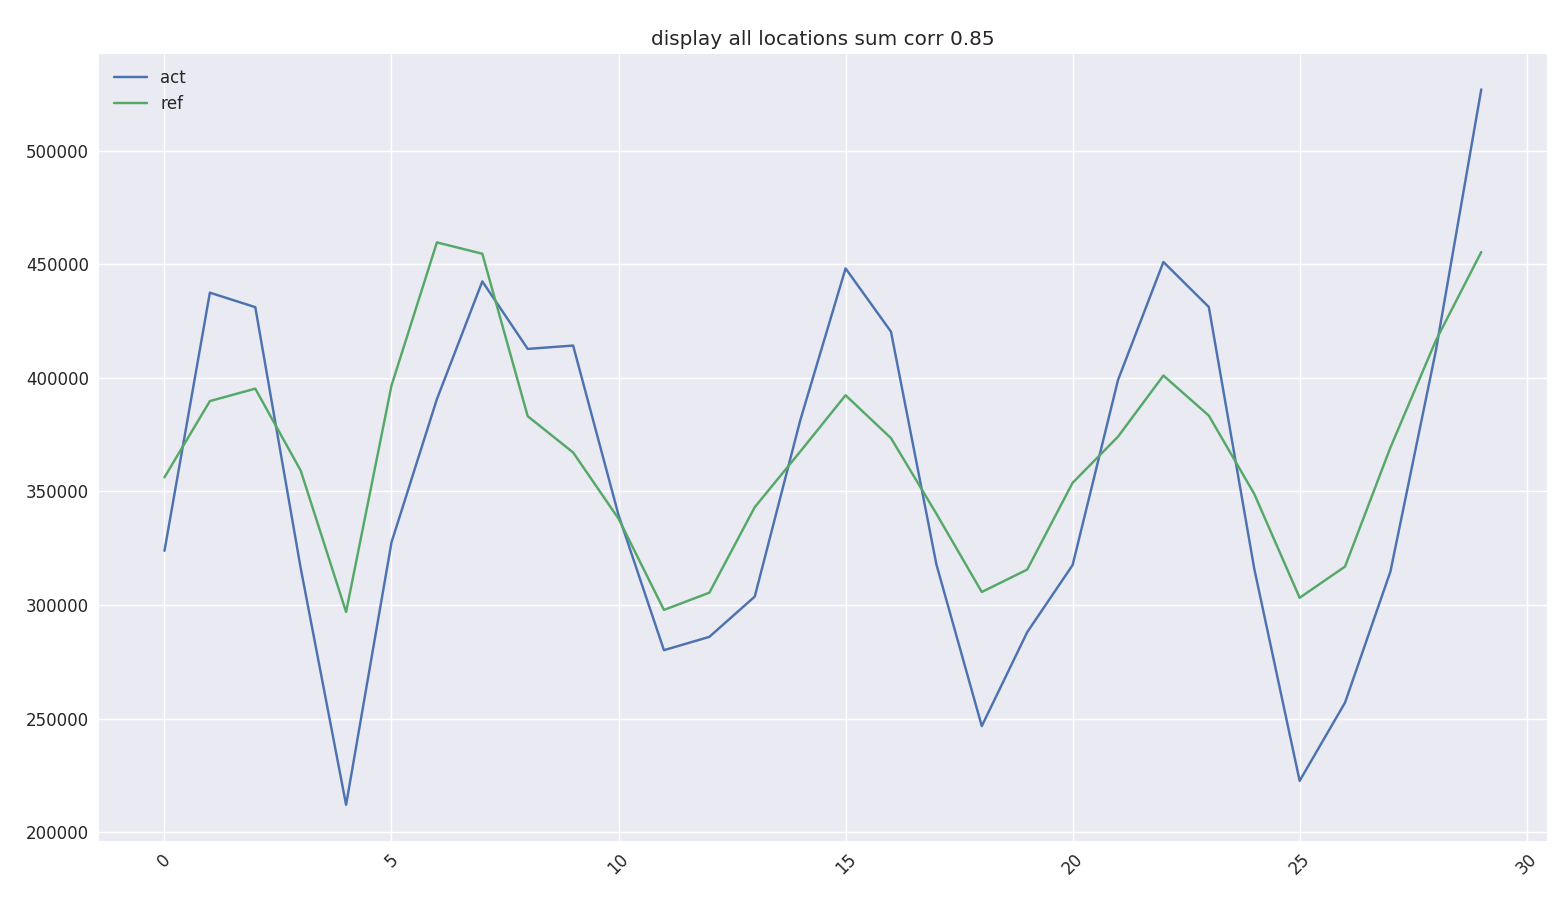 curve blind, june
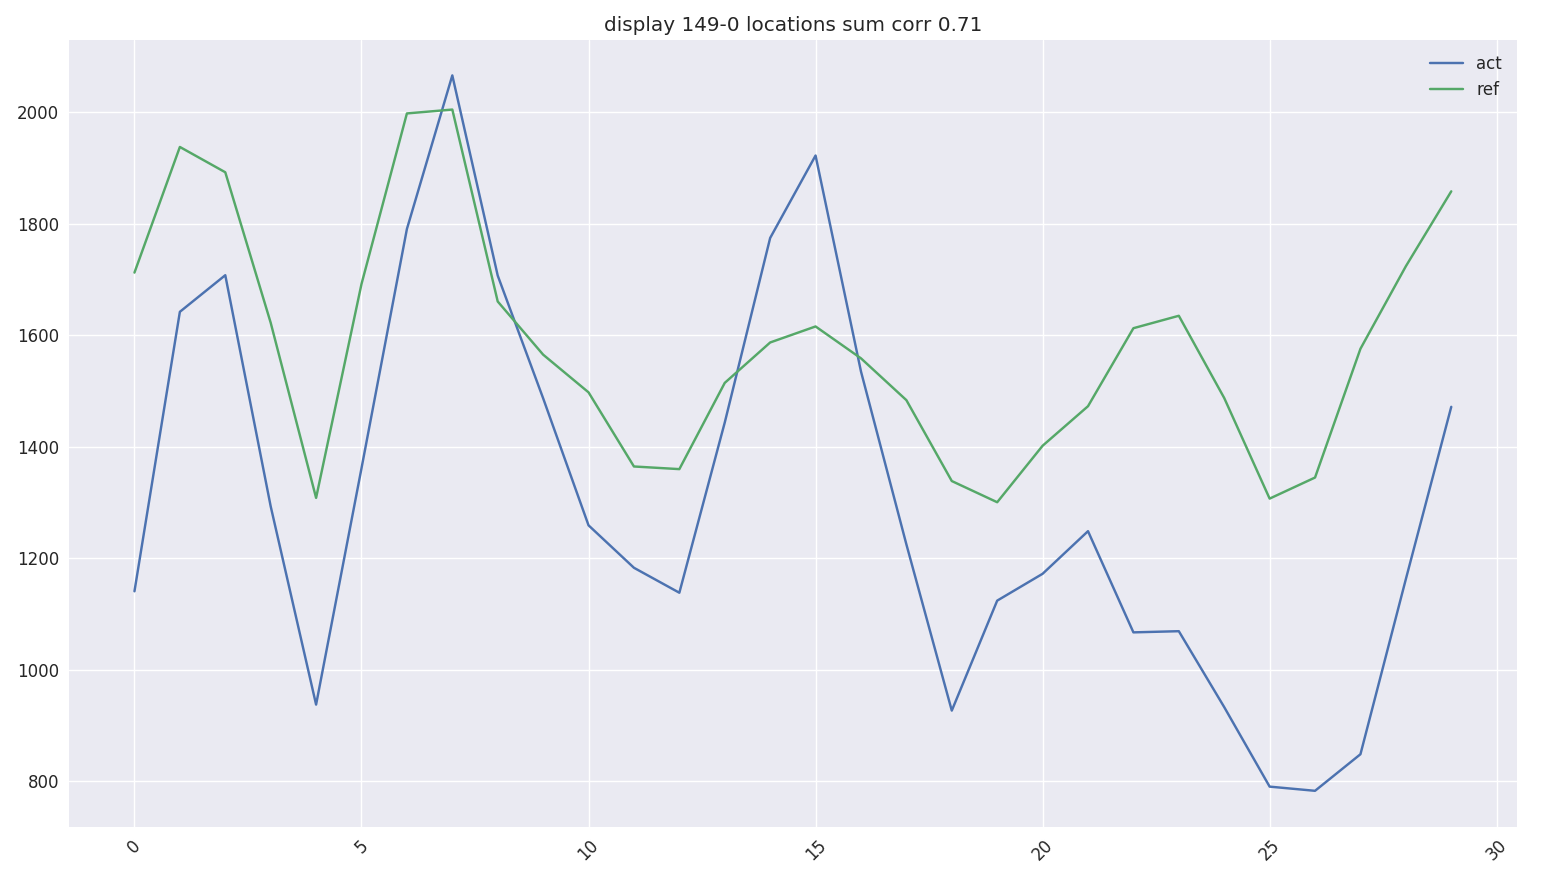 curve
blind_single2
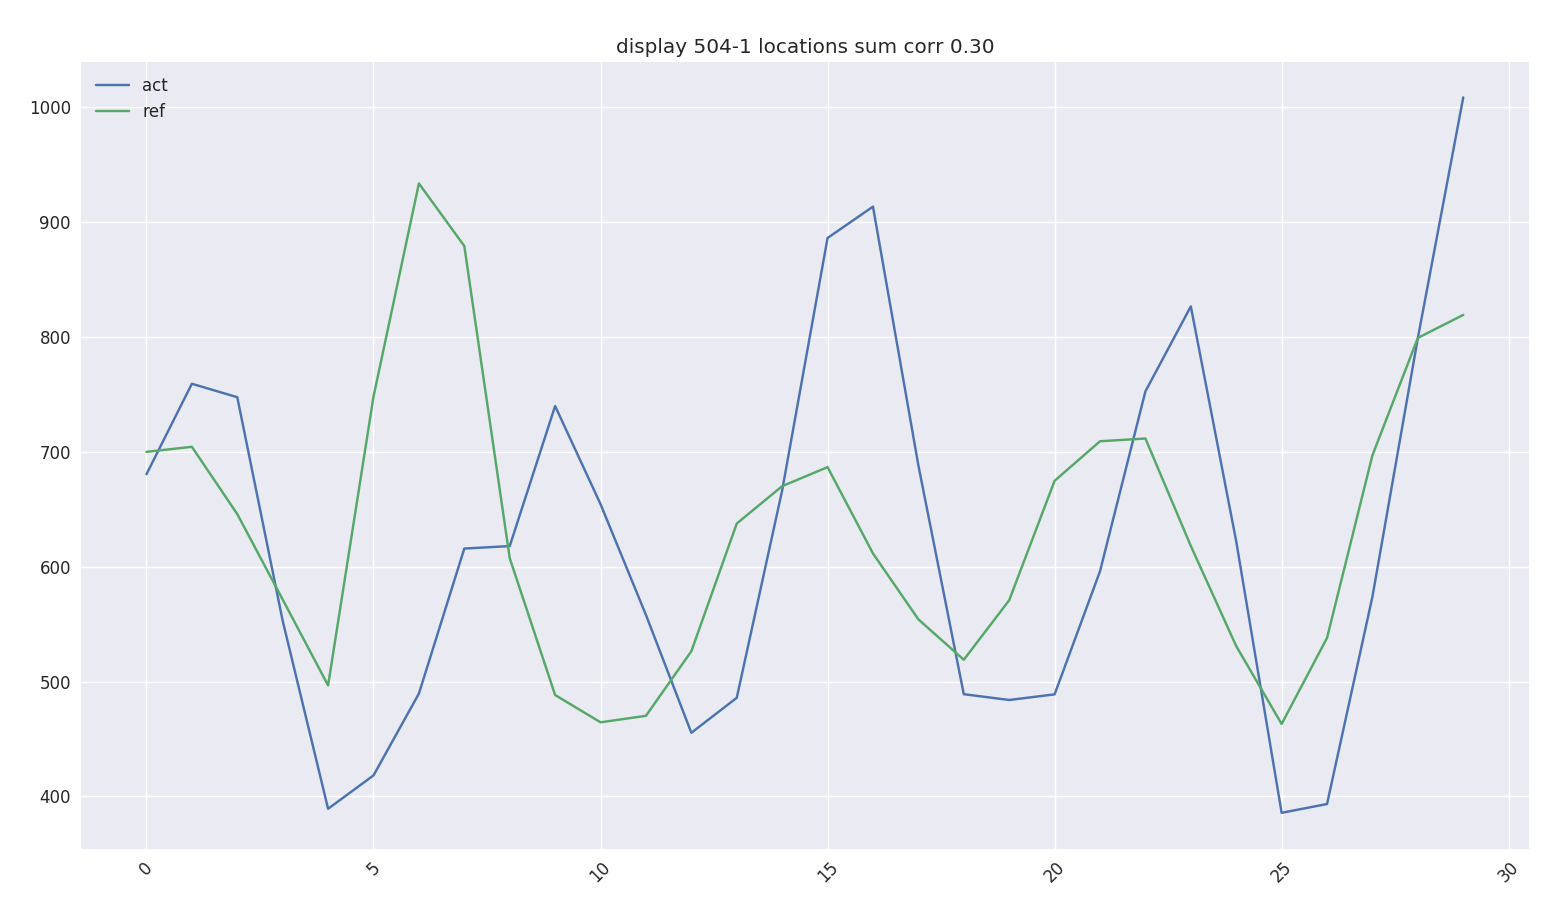 curve
blind_single
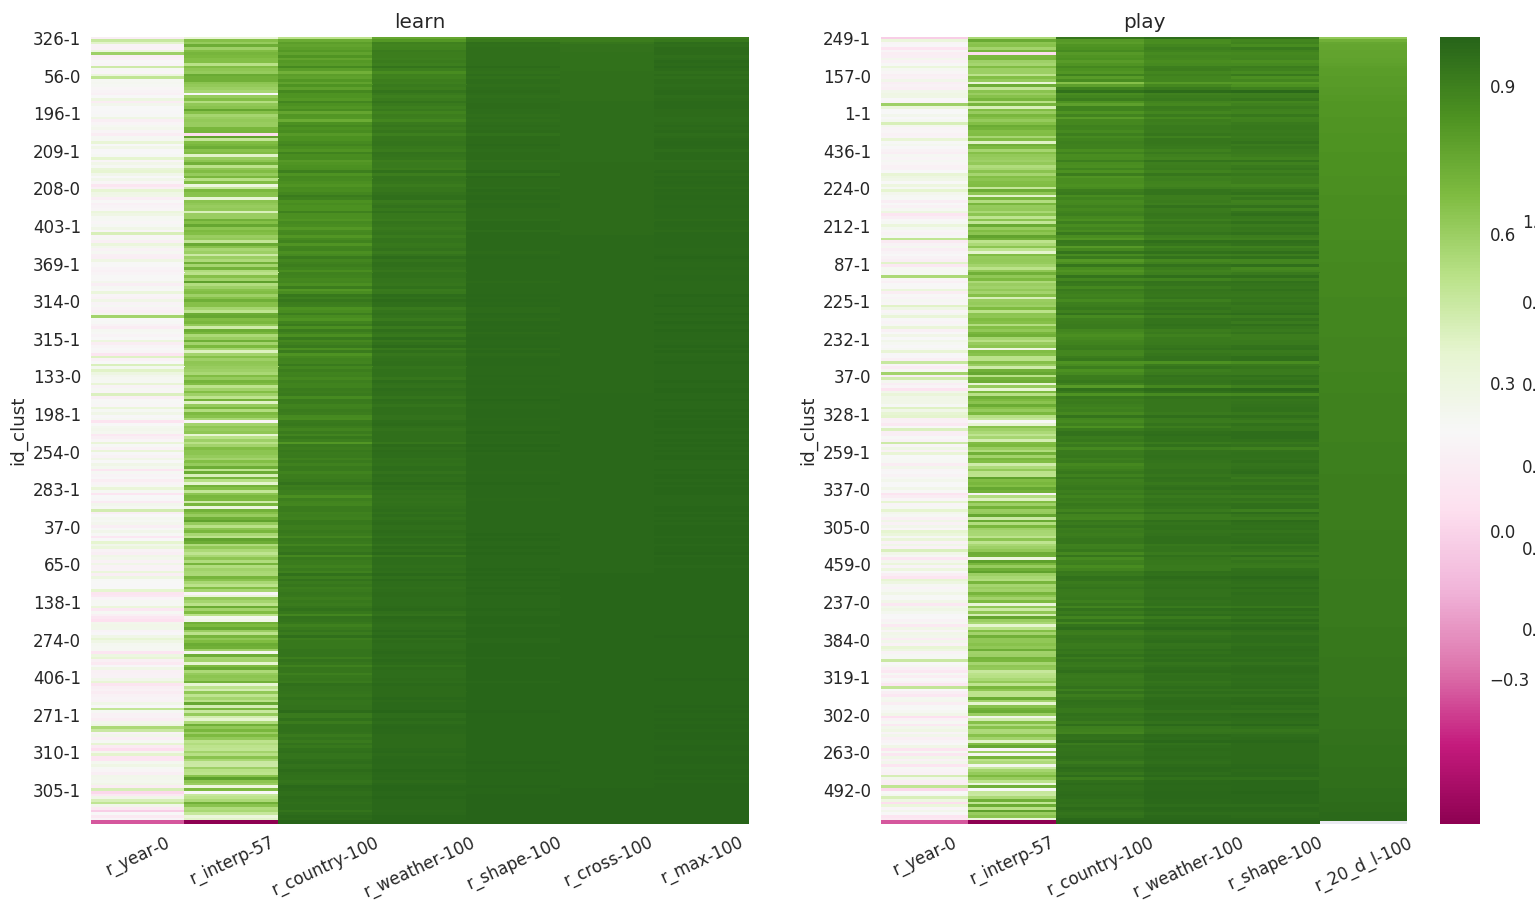
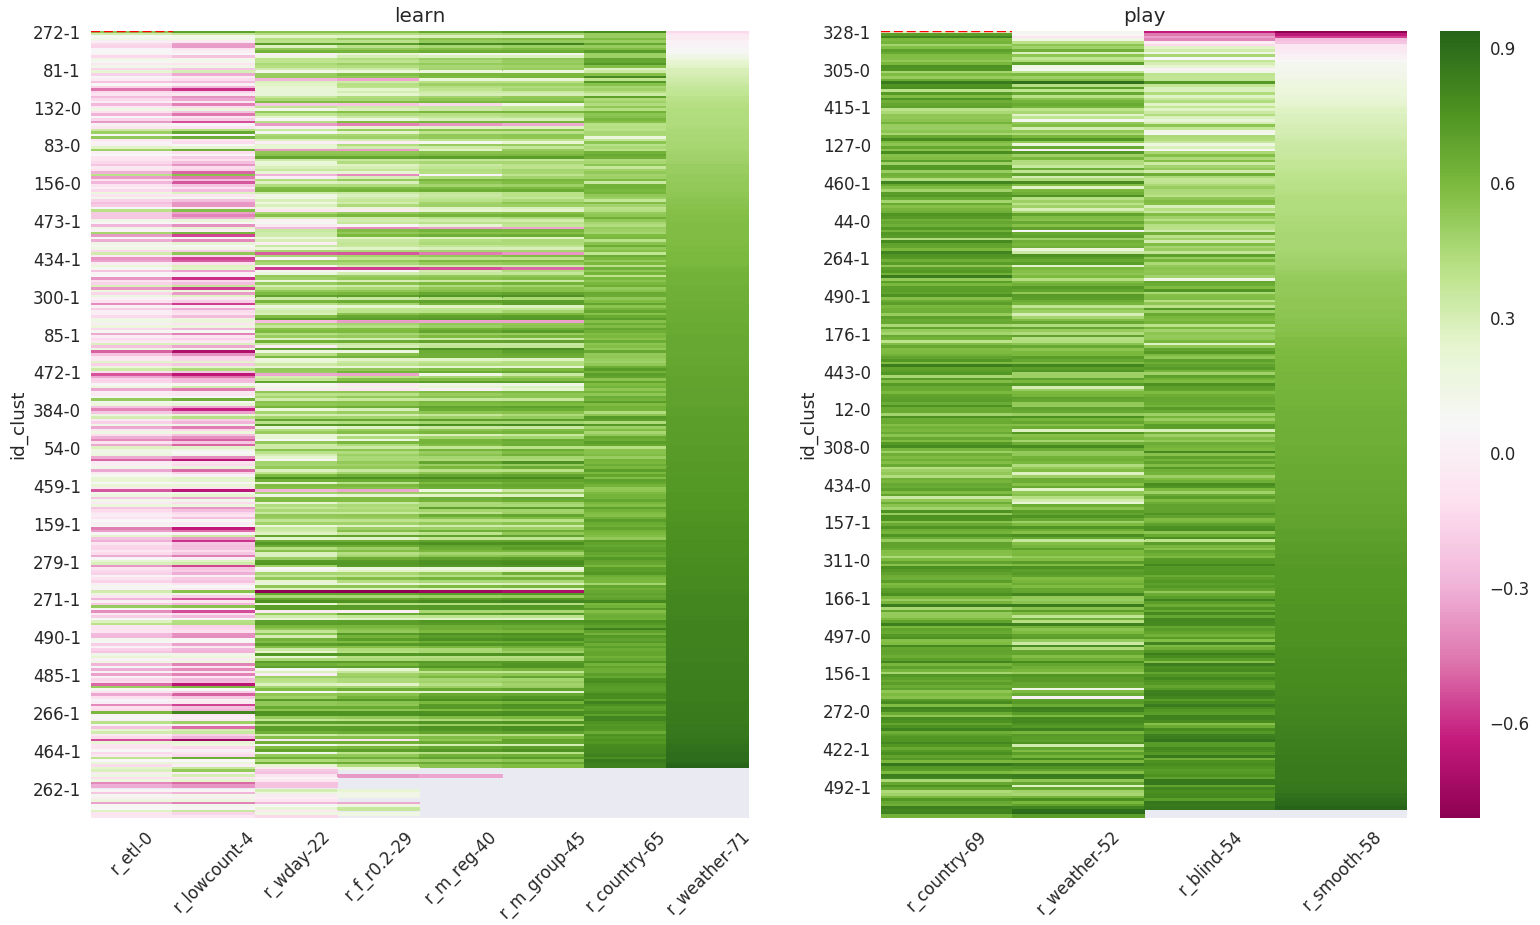
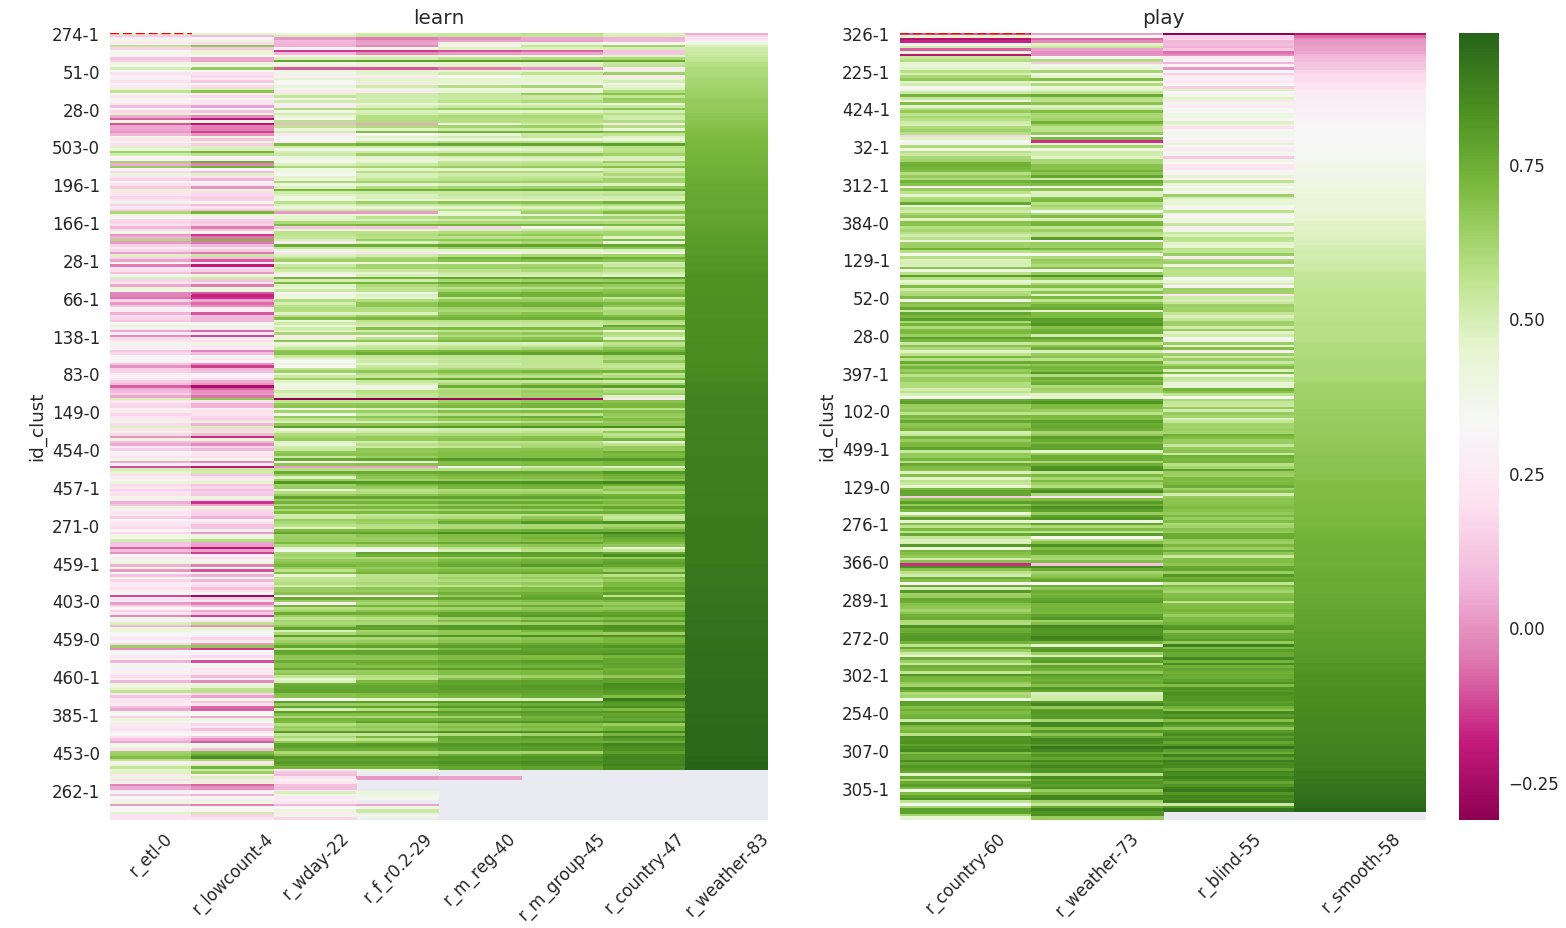 scoring on the different learning steps until
blind test
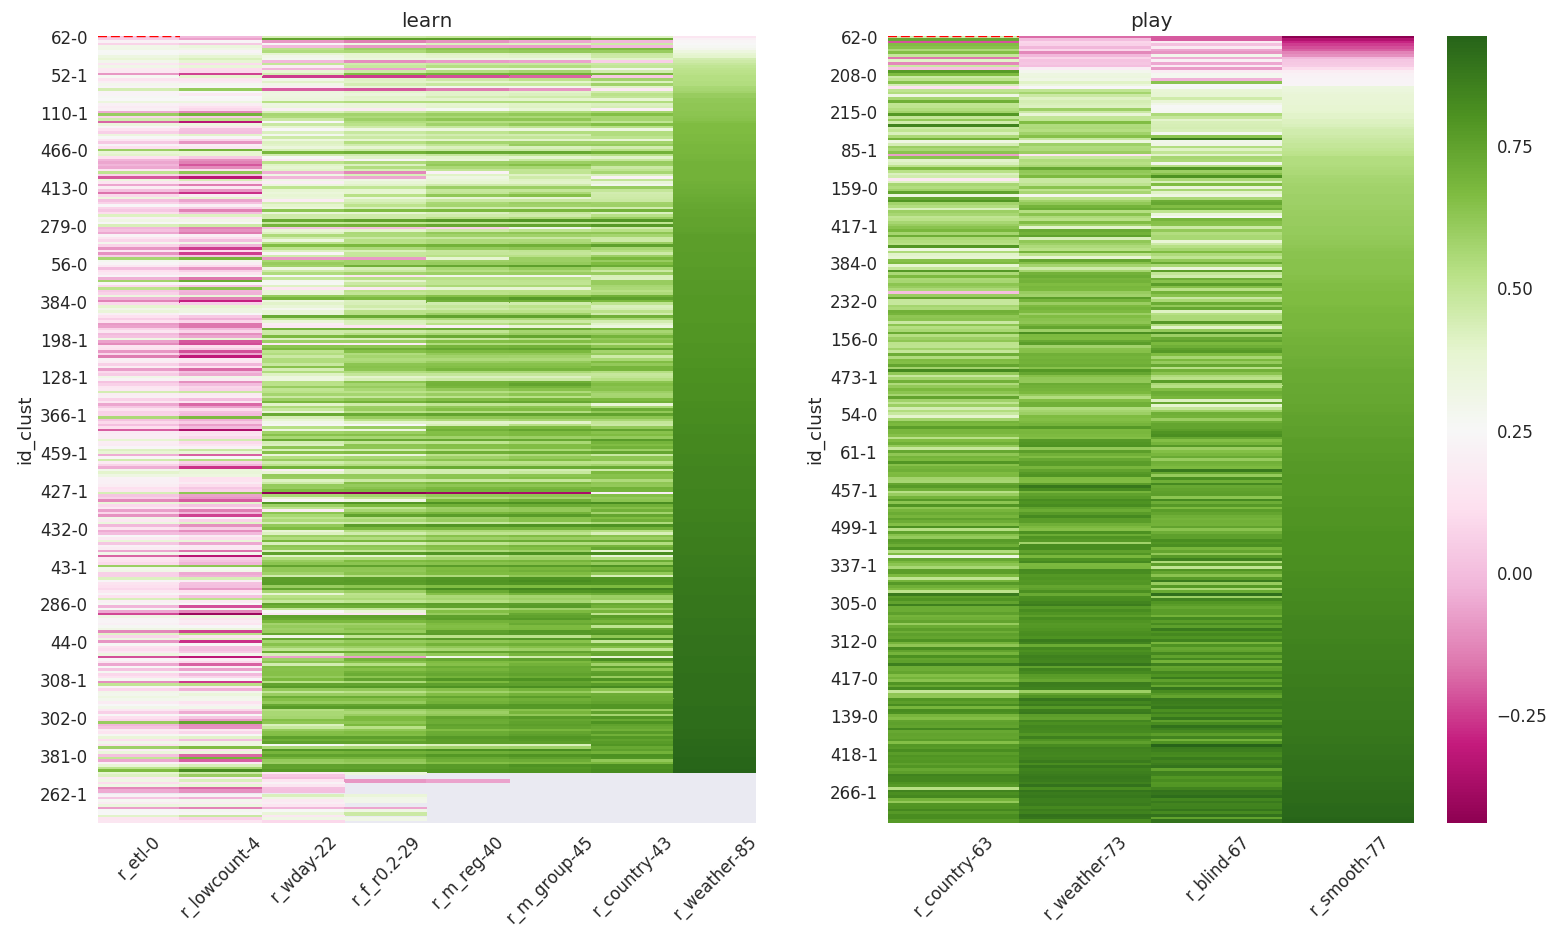 learn
play_randomDays
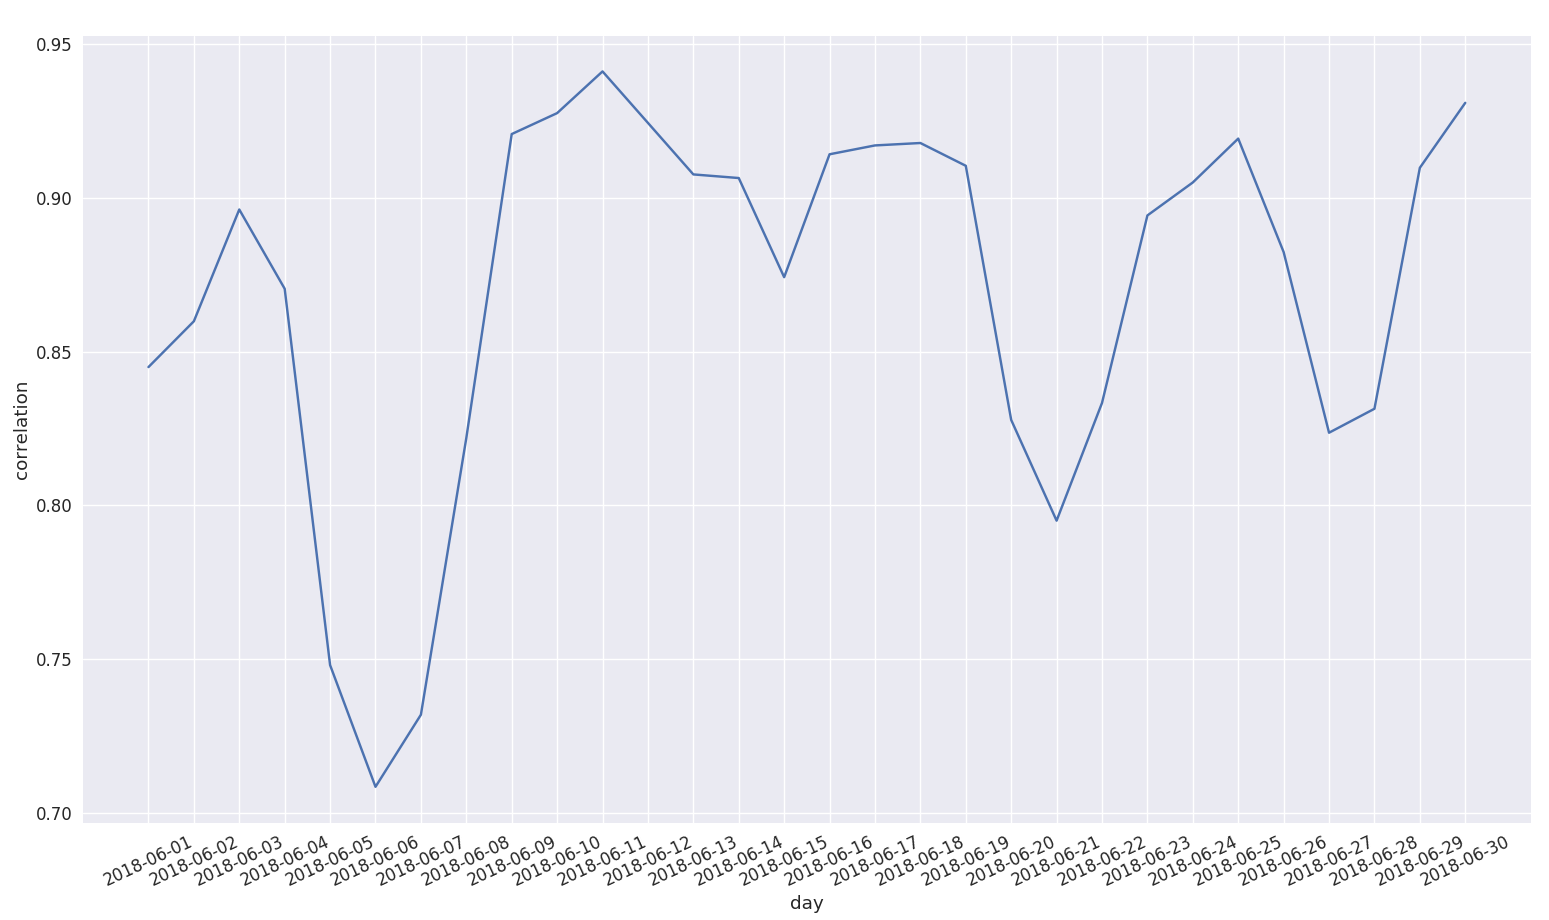 correlation over locations
