Spiega documentation
- Knowledge sharing
- Portfolio
mini hubs
In this project we want to assess the convenience of temporary storage called mini hubs in the last mile delivery. If mini hubs prove to be more convenient than van2door deliveries a competitive price can help unroll the business model to the market.
This work will as well suggest the best spots for these mini hubs and the operational advantage in handling deliveries.
description
Mini hubs are short retention parcel (indicated as
p
) stores located in strategic places in densely populated area.
mini hubs
can be of different types:
-
rented areas: 3k€/month capacity 2k
p, 1k€/month capacity 500p -
minimarket: 0€5/
pcapacity 50p -
lockers: ?€/
pcapacity 30p
The mini hubs allow :
- to avoid van delivery door to door (traffic, parking, bad timing)
- to match the delivery time
- to re-iterate delivery
- to redistribute workforce
- to use less expensive vehicles
The mini hubs allow the redistribution of shifts and workforce where we consider few main categories:
- van drivers for bulk delivery
- cart drivers for door to door delivery
- merchants storing parcels
- lockers
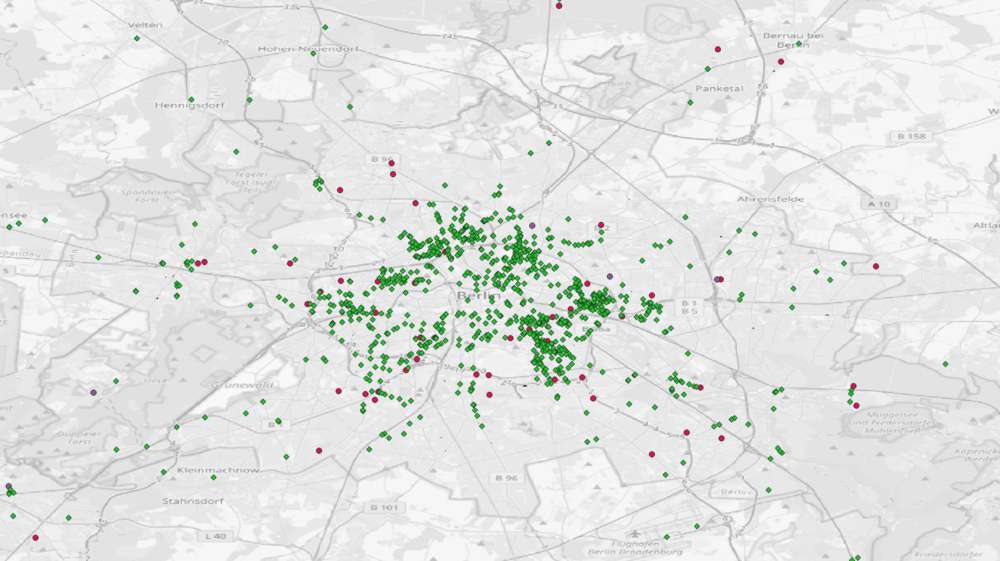
distribution of potential mini hubs (green) and pickup stores (red)
When a customer purchases a good the parcel gets ready in one of the big store of the city. In this project we want to compare the costs of different scenarios :
- van delivery warehouse to door
- same day in the evening
- van delivery warehouse to hub, hub to door
- hub2door in the evening
- hub2door a day after
variables
For a precise calculation we need to define few variables to calculate the total cost of the operation.
We model the transportation options
| type | capacity | av speed | service time | charge time | total cost |
|---|---|---|---|---|---|
| van |
200
p
|
35km/h |
90s/
p
|
4h | 40 €/h |
| cart |
75
p
|
18km/h |
30s/
p
|
0h swappable | 35 €/h |
Service time is the time per parcel for:
- find a parking
- load/unload/sort the parcels
- reach the customer/co-worker
- start driving again
charge time is the time the vehicle is unavailable, swappable batteries reduce the time to zero.
total cost includes:
- driver salary
- vehicle cost (maintenance, renting)
- fuel/electricity cost
Deliveries per day
is the estimated number of orders per day which will be simulated: 8k
p
/day
methodology
The objectives of this work are to compute and compare the costs of different operation schemes. The target is to find the most convenient location and size of the mini hubs.
The orders will be simulated randomly across the city, the delivery time is within the day at early stages. Vans and carts have different speed and operation times, they will require separated routing and time estimates.
We will model 50 pickup stores which are collecting the orders and preparing the parcels. We will locate at first the stores where big shopping malls sit.
-
identify the pickup stores: using
overpass-turbo
with
node["shop"="appliance"]({{bbox}}); - pick the minimarkets as possible locations for minihub (whitelist)
- build a graph for vans
- build a graph for carts
- divide the city in geohashes (resolution 8) and pre compute the routes from geohash to geohash
-
create a batch of simulated deliveries (8k
pper batch) across the city (uniform on the graph nodes) - create the cost function for van and for cart
- cluster orders and select the closest minihub from the whitelist
- compare van2door with van2hub + cart2door
Successively additional information should be added to the project:
- isochrones for hubs
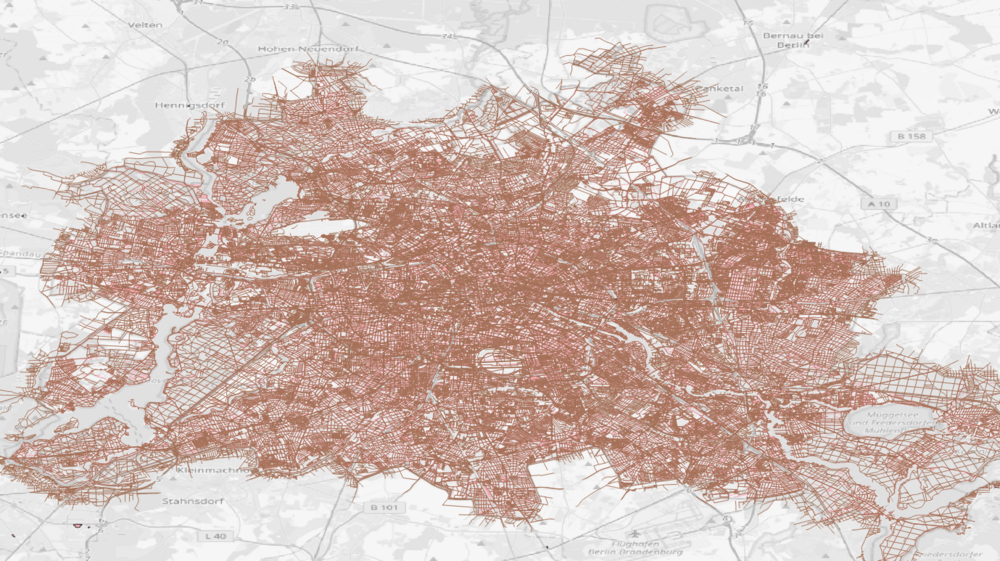
created routing graphs for vans and carts
preparation
We are using a geomadi library called graph_create to download and subset a graph for Berlin. We than calculate all the geohashes with precision 8 and assign a unique node to each geohash.
We use routing_node2node to precompute all the routed distances from geohash to geohash, both for vans and for cycles.
We create a batch of different orders, for each batch we find the mini hub clustering a specific distance radius and calculate all the routes.
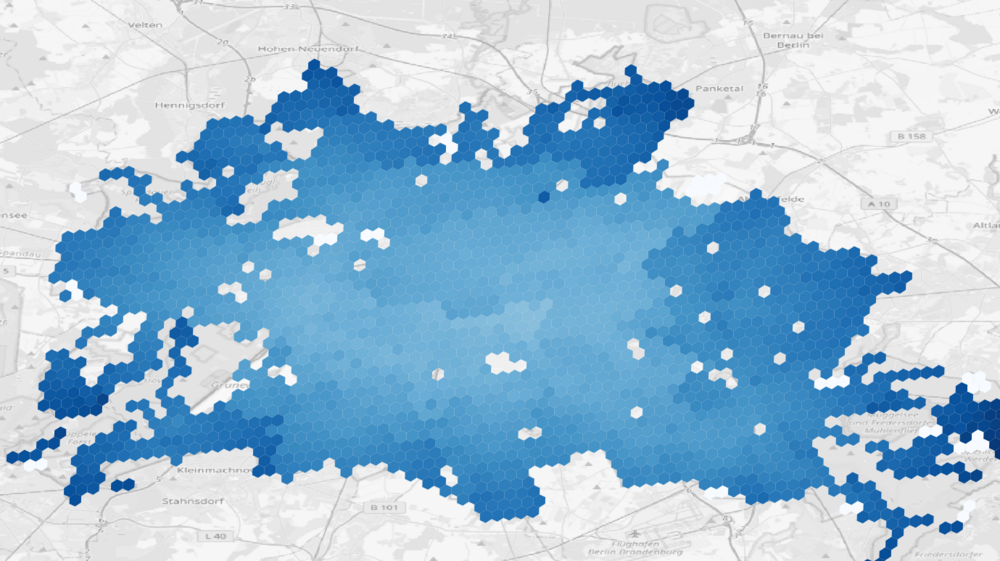
relative distance between geohashes the lighter the shortest the distance
steps
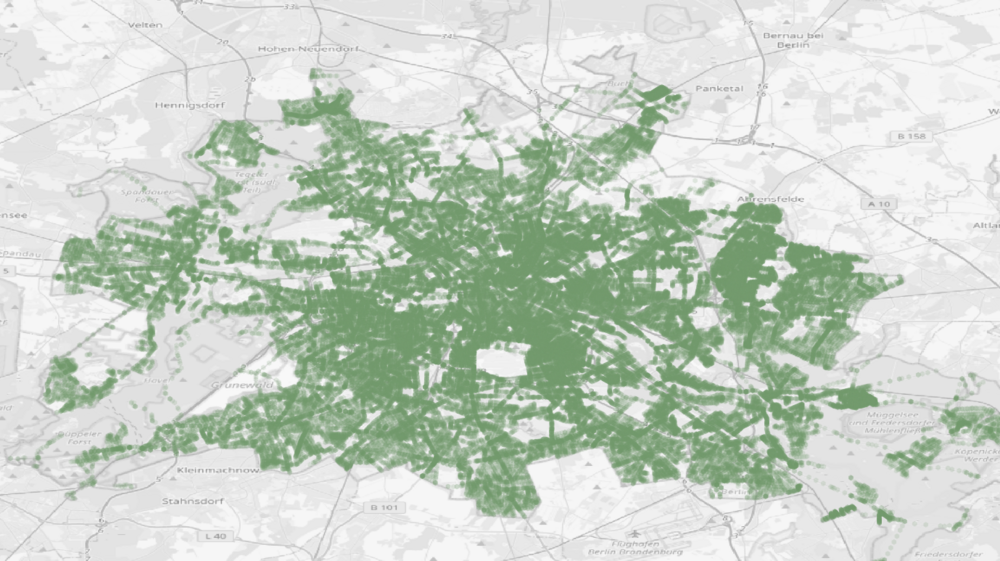
Demand simulation will come from randomly selecting graph nodes
The simulation considers the following steps:
- generate orders
- assign orders to pickup stores
- assign batch mini hub to order
- route pickup to hub
- route hub to door
- compute averages per ride
- calculate costs for different scenarios
output
The simulation will allow the following outputs and analytics
- shift length
- mini hub size and position
- cost scenarios
The main output table displays the averages values per ride
| nr_hub | distance pickup/hub | distance hub/door |
p
from pickups
|
p
from hub
|
time pickup/hub | time hub/door |
|---|---|---|---|---|---|---|
| 155 | 392 | 16 | 306 | 63 | 107 | 17 |
results
The simulation provided the following results (time and distance are approssimated):
Data available under
intertino
| nr_hub | distance pickup/hub | distance hub/door |
p
from pickups
|
p
from hub
|
time pickup/hub | time hub/door |
|---|---|---|---|---|---|---|
| 155 | 392 | 16 | 306 | 63 | 107 | 17 |
| 77 | 357 | 24 | 306 | 103 | 71 | 26 |
| 56 | 320 | 32 | 306 | 136 | 55 | 34 |
| 44 | 295 | 39 | 306 | 173 | 43 | 43 |
| 34 | 261 | 49 | 306 | 225 | 33 | 55 |
| 29 | 232 | 60 | 306 | 263 | 29 | 65 |
| 25 | 217 | 69 | 306 | 306 | 25 | 75 |
| 23 | 197 | 74 | 306 | 332 | 23 | 81 |
| 20 | 202 | 81 | 306 | 382 | 20 | 92 |
| 18 | 198 | 90 | 306 | 425 | 18 | 102 |
| 0 | 571 | 0 | 306 | 0 | 0 | 0 |
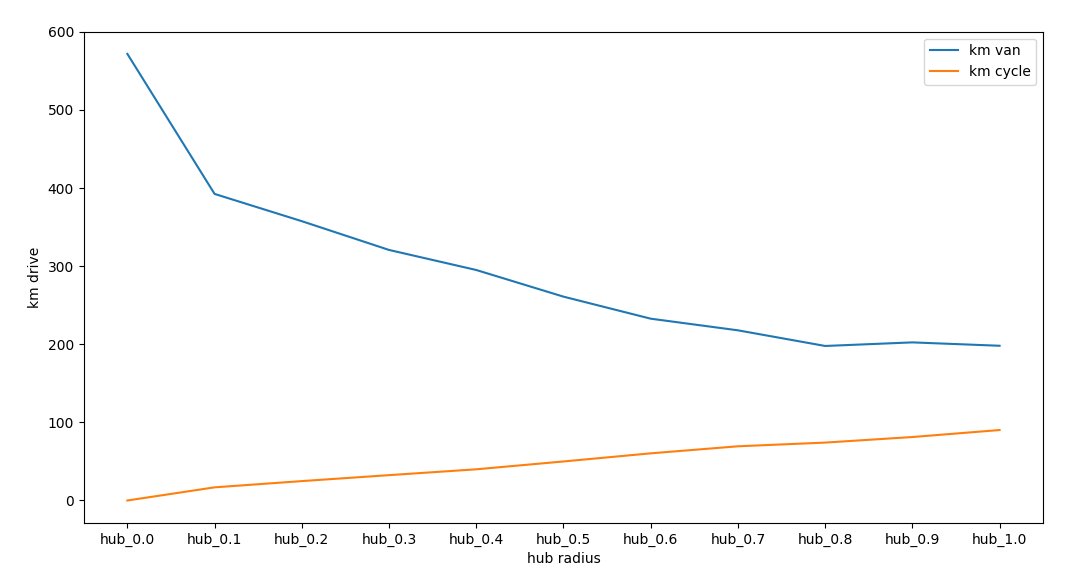
van and bike drive distances per radius of hubs
At a first sight the kilometers run between pickup stores and hubs are really large. Considering the driving time between any pickup store to any point in the city it might not be too unrealistic.
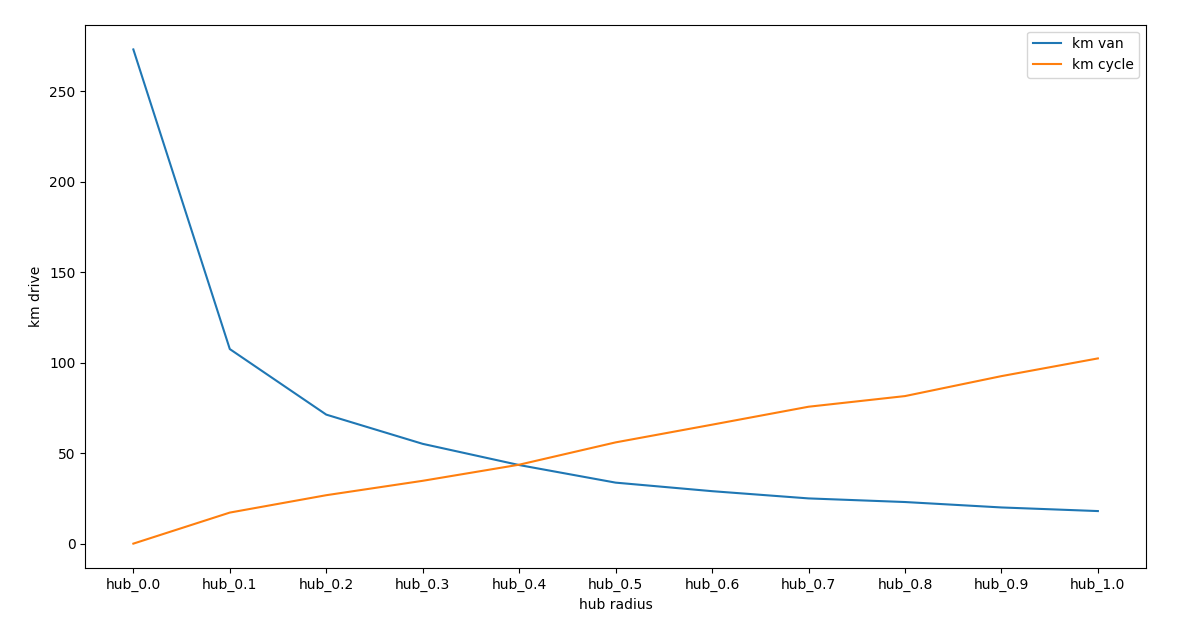
van and bike drive time per radius of hubs
Too many hubs cause a long driving time for vans and don't increase much the service time around the hub.
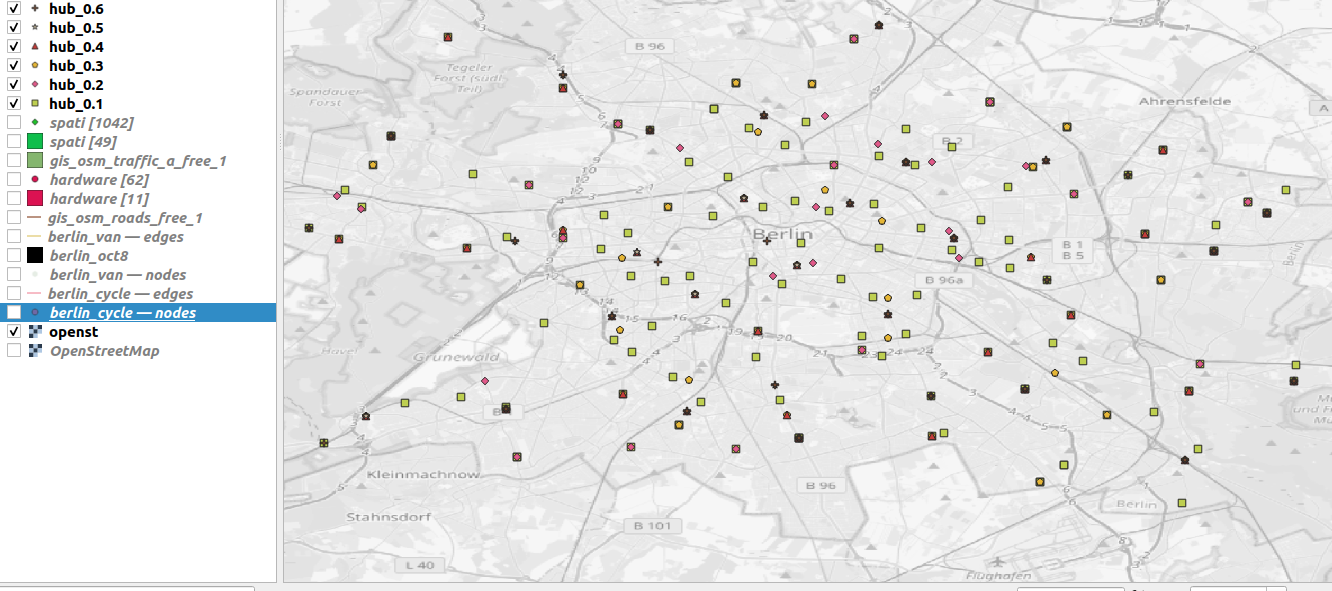
best spot for an hub for a given location
The hubs are closing to a crossing in dense populated areas.