lagged metrics
In this project we want to investigate main differences between the metrics on the call and lagged metrics
In a past company our business model was revenue share and metrics where the essential brick of our collaboration.
My job was to build such metrics and make sure that both parties could measure them the same way and agree on reports. Those metrics were lagged because we need to calculate the impact over a large amount of time, otherwise ML would have maximized short-sighted wins.
Before starting any project we were as well analyzing real data to see whether any optimization would be statistically relevant and the business impact larger than the effort. We were as well planning a test phase to prove to the stakeholder the reliability of the solution.
Once you have a metric which brings real value, like customer lifetime value or booking conversion rate, ML optimizes for real benefit and the client and the provider don't need to argue about the impact.
A powerful metric design (usually a principal indicator and control metrics) with stakeholder management is a key component of project success and avoids most of the future problems.
Some metrics I've been working on
- customer lifetime value
- operation cost reduction
- booking conversion rate
- click rate
- response time
- ...
difference
The lagged metrics considers a time span of 25 days when the customer could call again and turn around. The lagged metric loses around 10% customers
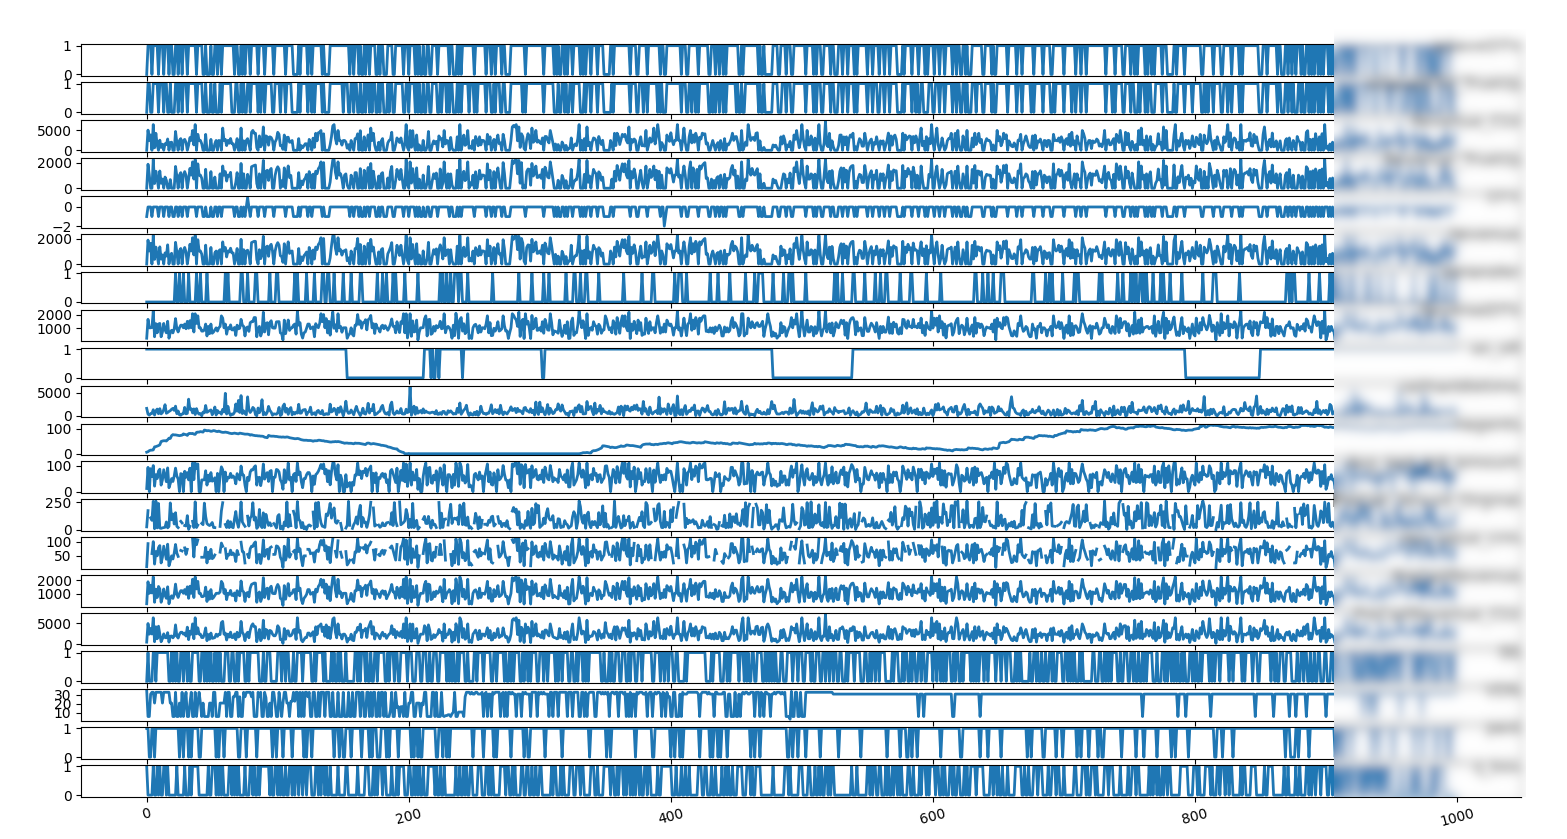
time series of on-call and lagged metrics
We have different metrics to predict
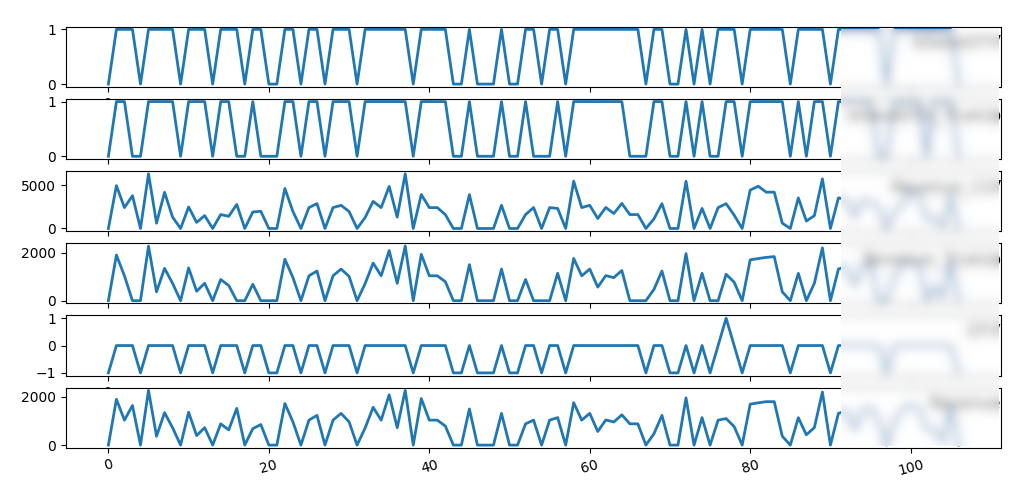
metrics to predict, on call and lagged
We clean the features
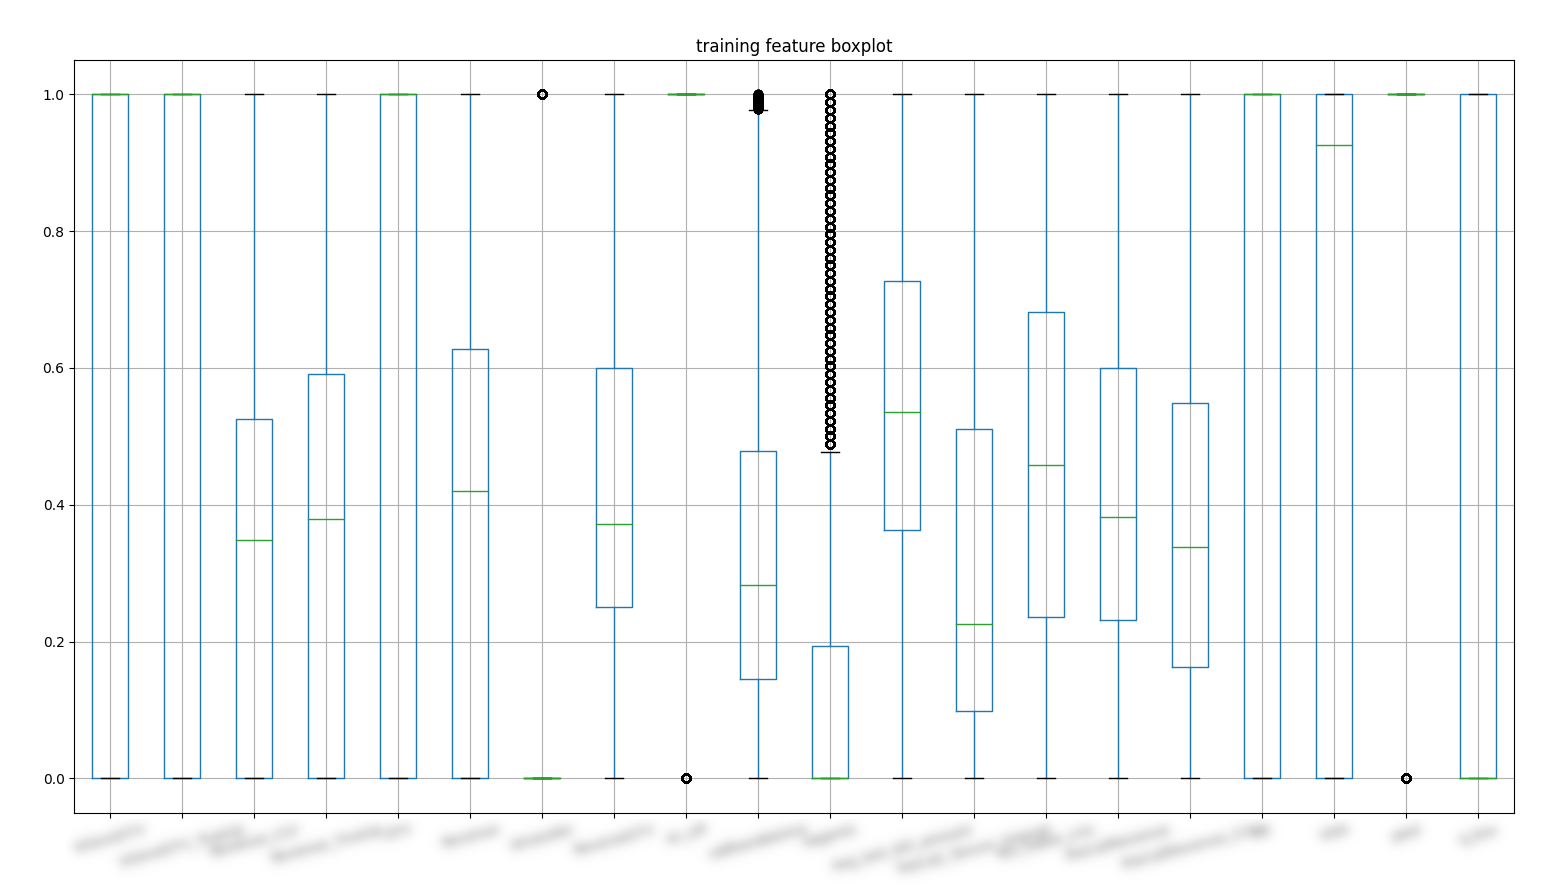
normalized feature distribution
We check the feature independency
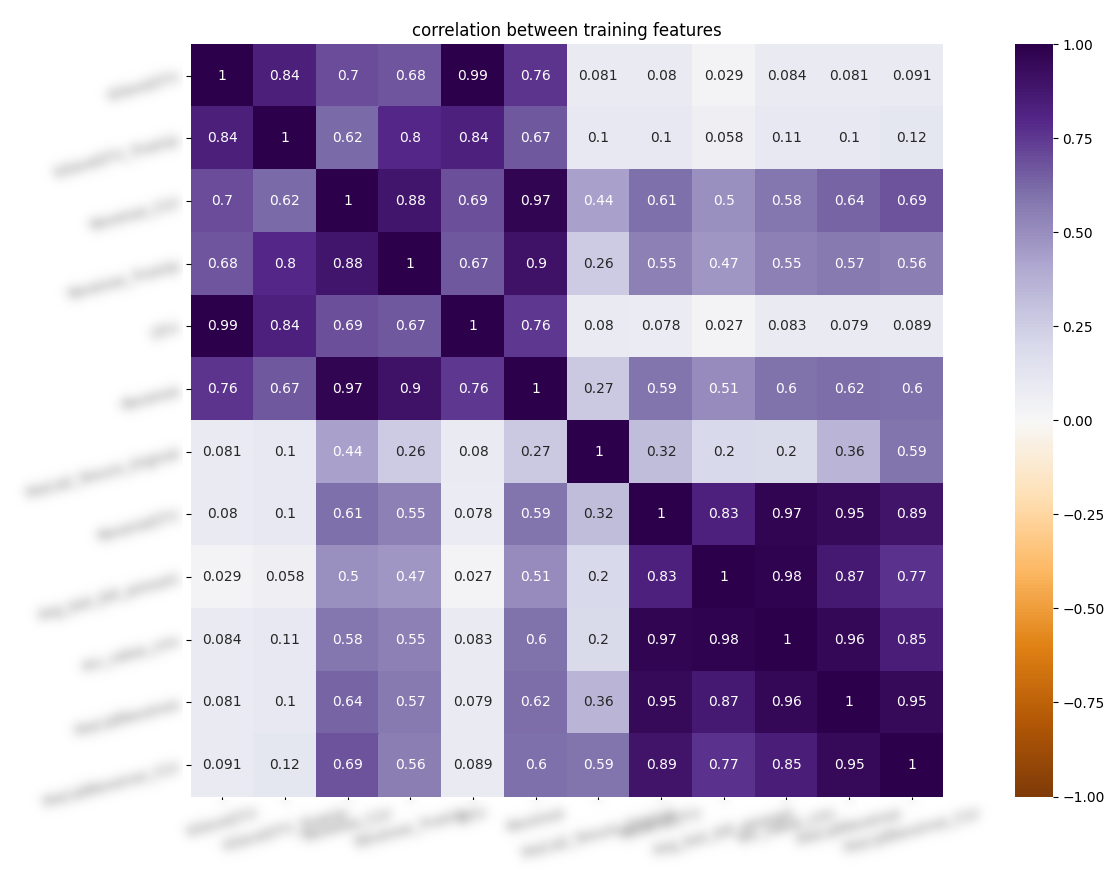
correlation between features
Effect of afiniti agent on feature distribution
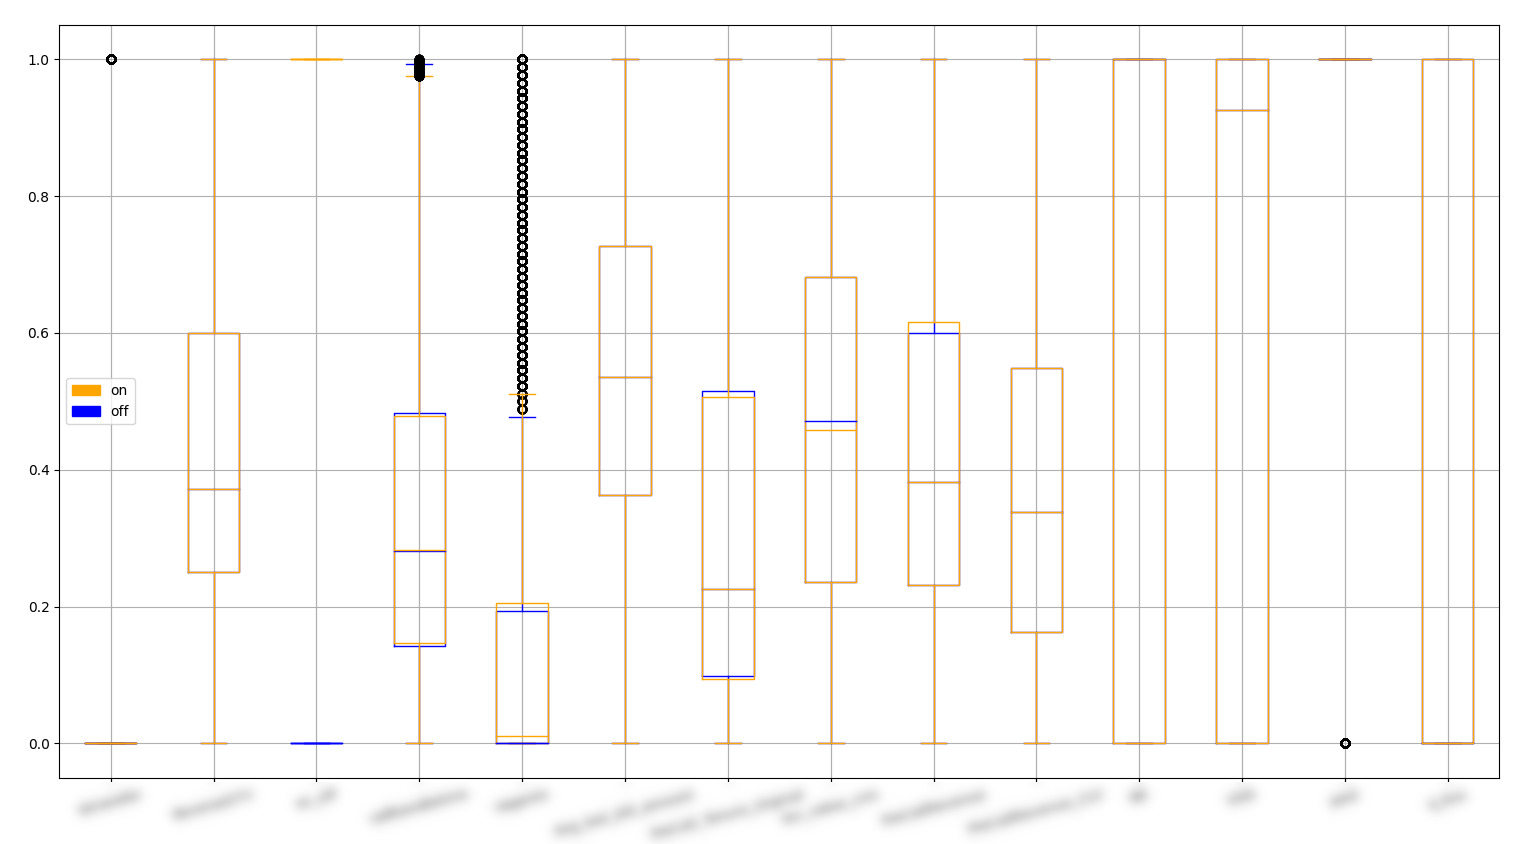
overlay of feature distribution
Overlay distribution of features on saved customers
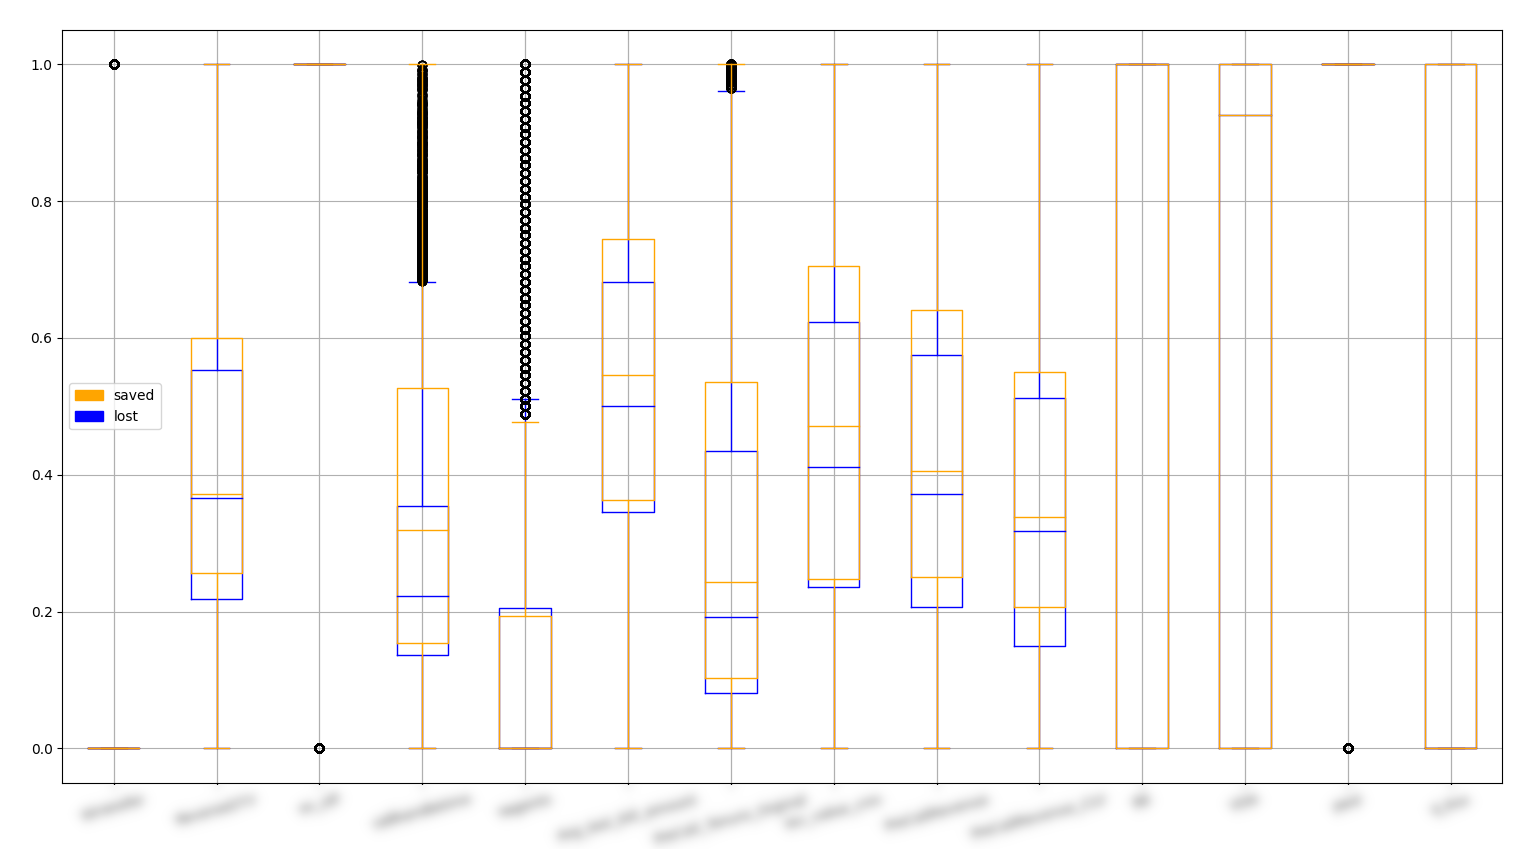
overlay of feature distribution
Overlay distribution of featured of saved/lost customers
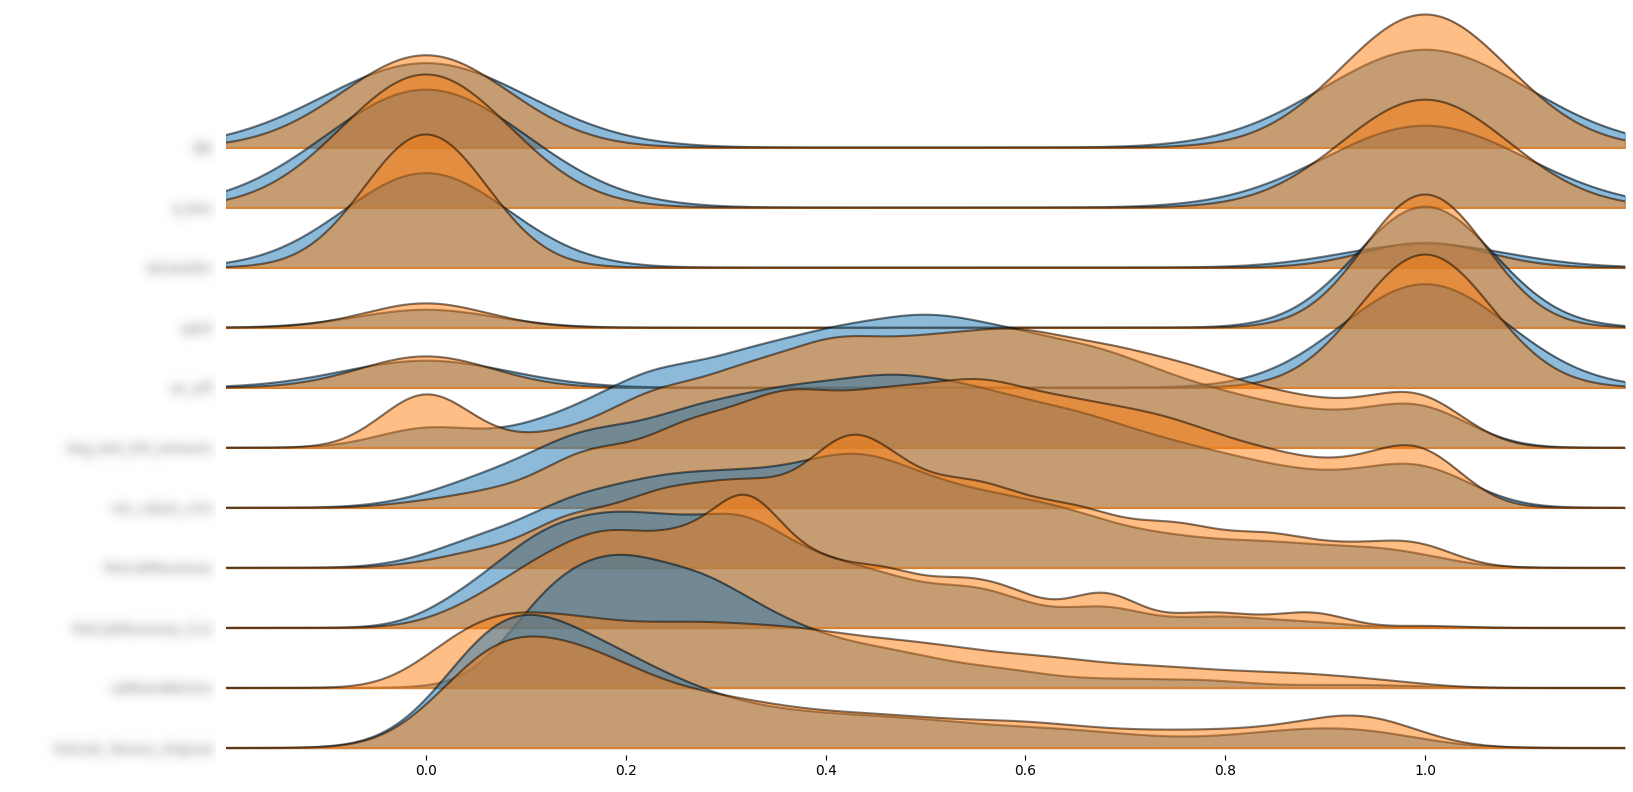
Overlay distribution of features: joyplot
We build a predictive model for the on-call metric
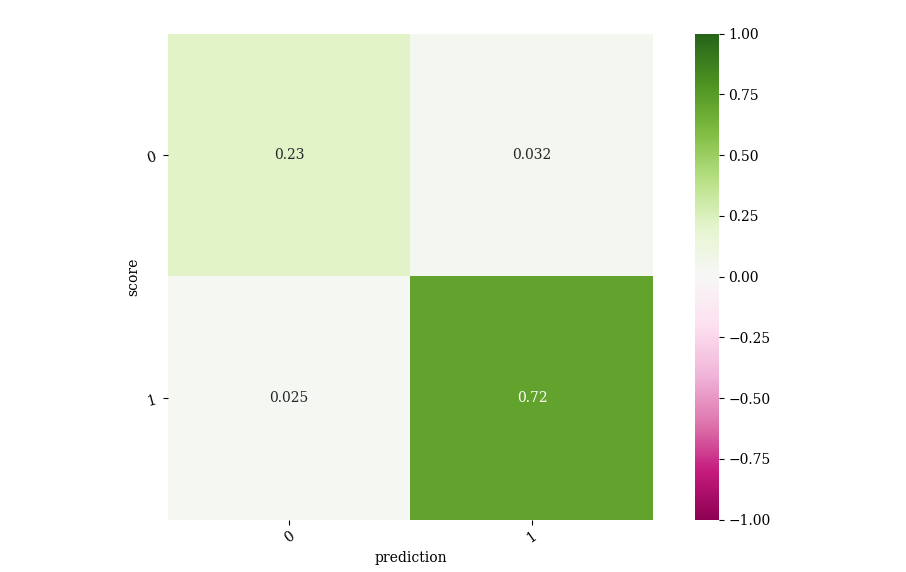
confusion matrix on prediction: on-call
We use the prediction of the previous model to predict the new metric
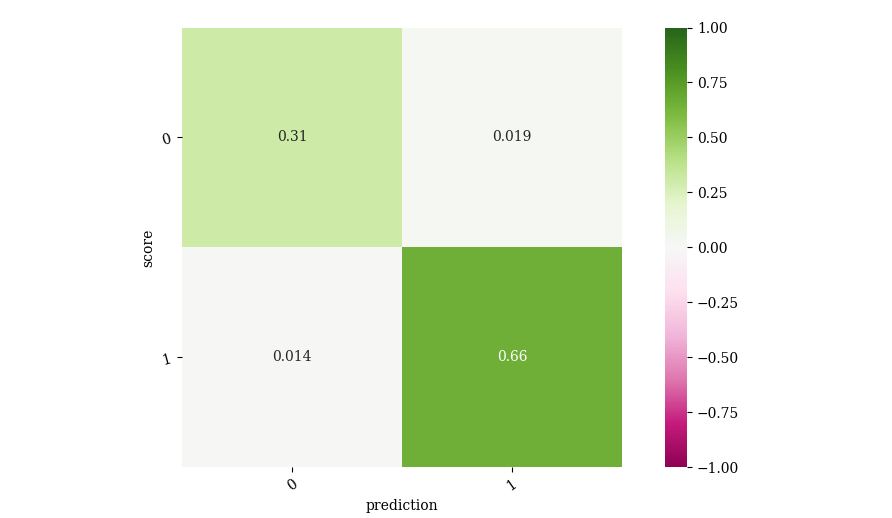
confusion matrix on prediction: lagged
We knock-out features to calculate the relative importance of that feature
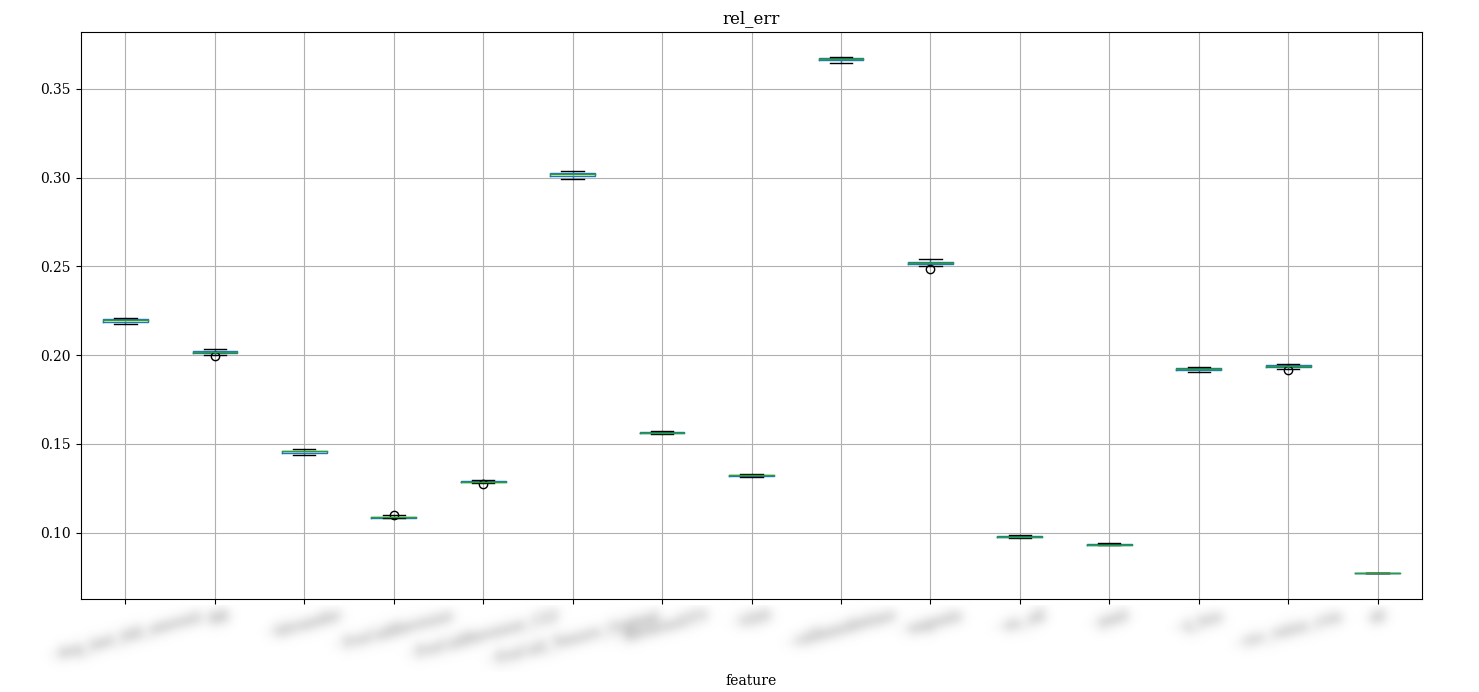
knock-out of features from trained model: on-call
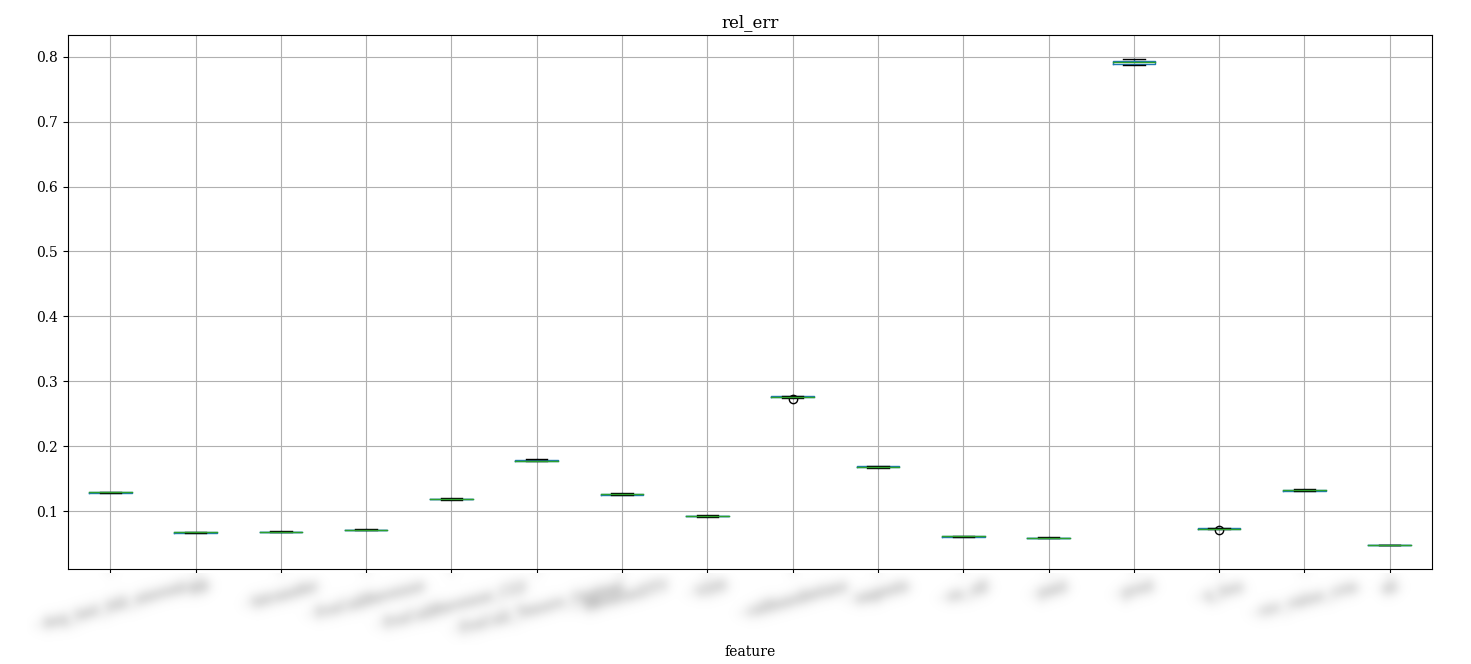
knock-out of features from trained model: lagged
We finally check the relative difference between on-call and lagged
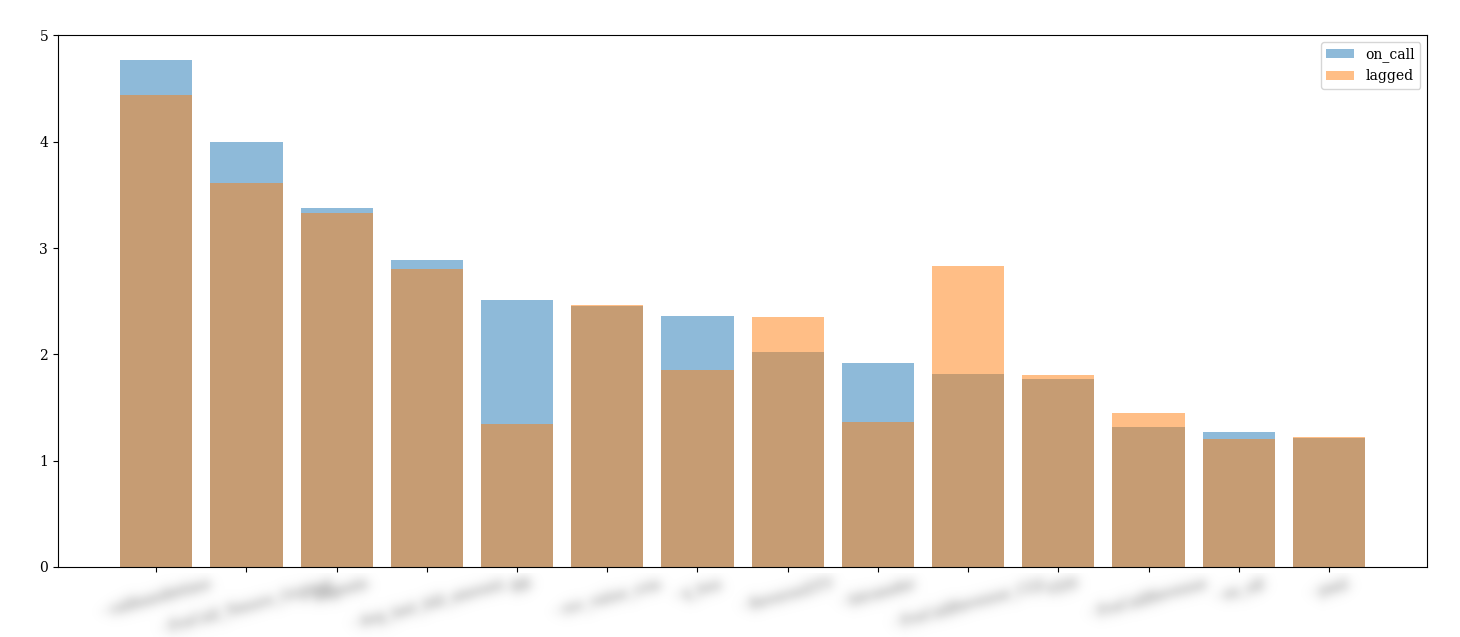
relative difference between feature importance in lagged metrics
We can study the relative feature importance
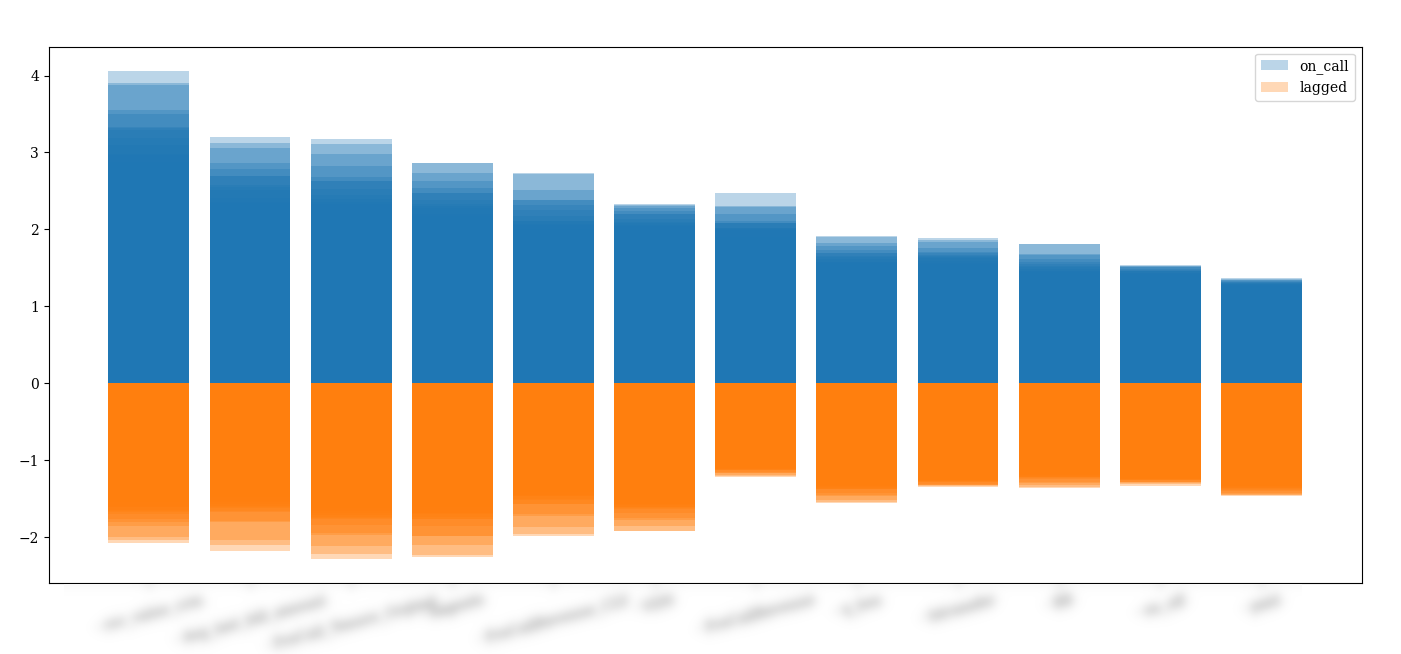
feature importance (week overlay)
and see how it evolves week by week
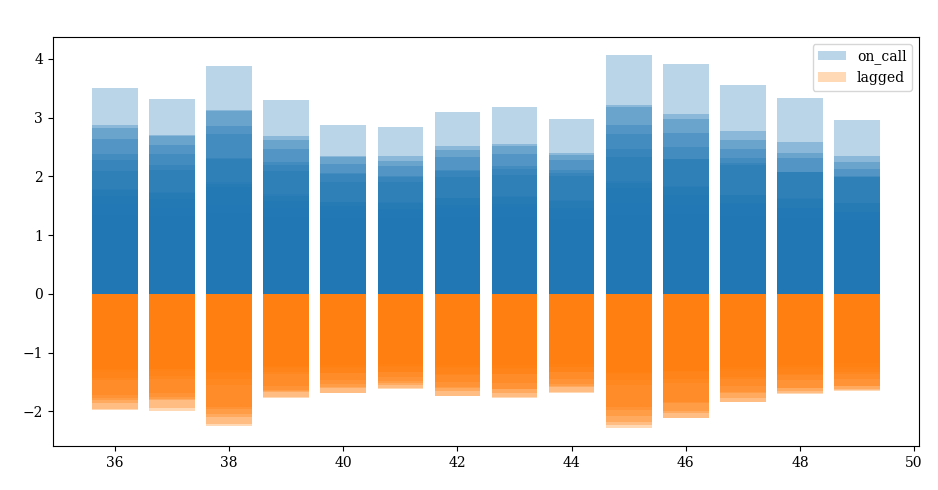
relative importance week by week
We study over week how the relative importance of that metric dropw over time
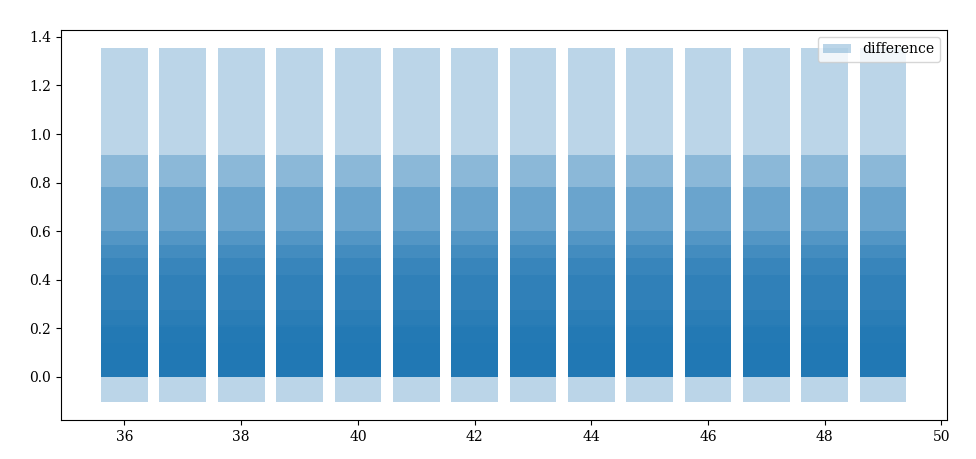
importance difference relative to lagged metrics
We calculate the lift depending on categorical metrics
$$ lift = SR_{on} - SR_{off}$$
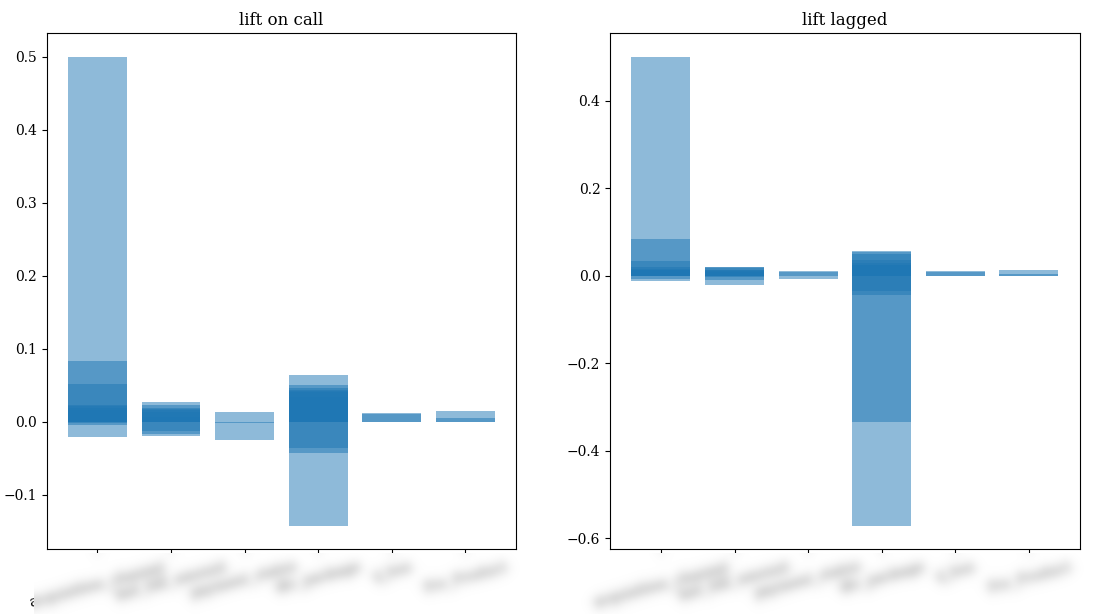
lift relative to categorical metrics
cohort reshuffling
We look month per month how the association of agents per area varies over time
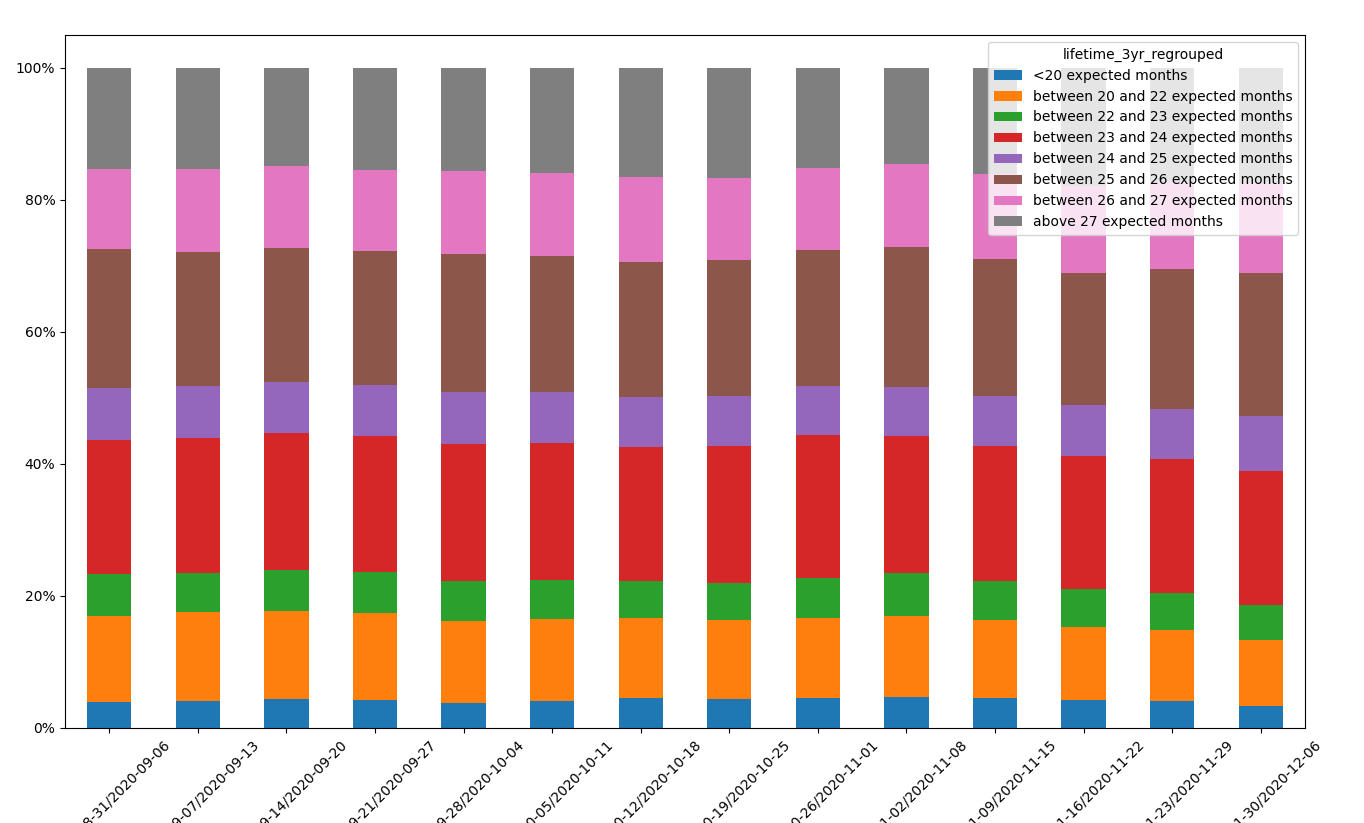
time series volume changes in cohorts
Shuffling among cohorts
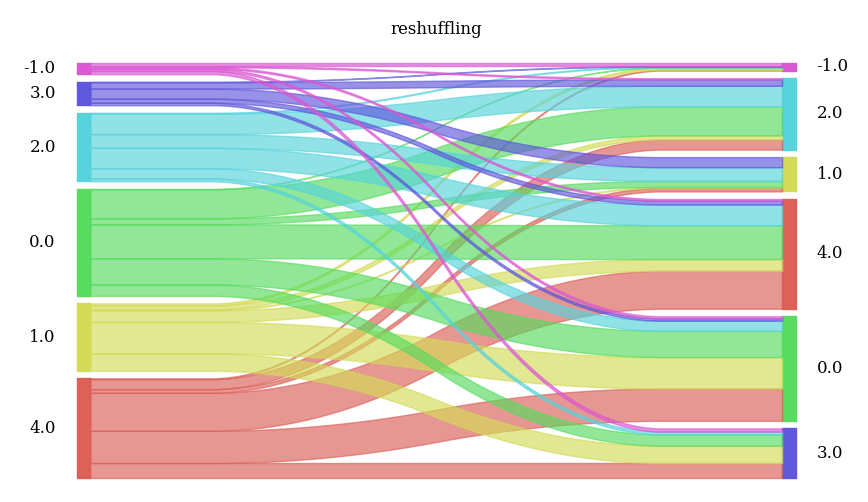
reshuffling of agents cohorts