Cleaning
#format date and time
fs$date = as.Date(fs$datetime,format="%m/%d/%Y %H:%M")
fs$datet = strptime(fs$datetime,format='%m/%d/%Y %H:%M')
fs$posted = as.Date(fs$date.posted,format="%m/%d/%Y")
fs$time <- as.POSIXct(fs$datetime,format='%m/%d/%Y %H:%M')
#parse descriptive time
fs[set,"hour"] = fs[set,"duration..hours.min."] %>% gsub("[[:alpha:]]","",.) %>% gsub("-.*$","",.) %>% gsub("[[:punct:]]","",.) %>% as.numeric(.)
#...
fs$duration = fs$sec + fs$min*60 + fs$hour*3600
#stopwords, stemming, cleaning
x <- tryTolower(x)
x <- removeWords(x,c(stopwords("english"), 'yeah', 'yep','&','"','quot','that','from','like'))
x <- gsub("[[:punct:]]","",x)
x <- gsub("[[:digit:]]","",x)
x <- gsub('(http.*\\s*)[^[:blank:]]+','',x)
x <- gsub('(\\.|!|\\?)\\s+|(\\++)',' ',x)
x <- stripWhitespace(x)
x <- stemDocument(x,language="english")
R functions for data cleaning and stemming
Transformation
Rearth = 6371;
normF = pi/180.
sigDist = data.frame(shape=fs$shape)
sigDist$theta = (fs$longitude-refPoint[2])*normF ##Euler's rotation
sigDist$ang = sin(refPoint[1]*normF)*sin(fs$latitude*normF) + cos(refPoint[1]*normF)*cos(fs$latitude*normF)*cos(sigDist$theta)
sigDist = sigDist[grepl("us",fs$country),]
sigDist$ang = acos(sigDist$ang)
sigDist$dist = sigDist$ang*Rearth
sigDist = sigDist[!is.na(sigDist$dist),]
sigDist$area = sin(sigDist$ang)*2.*pi*Rearth
sigDist$count = sigDist$dist/sigDist$area
sigB = seq(1,100)*max(sigDist$dist)/100
sigDist$br = cut(sigDist$dist,breaks=c(0,sigB),labels=sigB)
sigD = ddply(sigDist,.(shape,br),summarise,rad=sum(count),count=length(count))
sigD$br = as.numeric(as.character(sigD$br))
Euler's angles transformation for distance calculation
import dataset in elastic search
notA = pd.read_csv("~/lav/dauvi/webapp/motion/" + "raw/clean.csv")
notA.fillna("",inplace=True)
sucS = ""
for i in range(0,len(notA)):
    idS = {"index":{"_index":notA.loc[i,'date'],"_type":"log"}}
    timest = list(notA.loc[i]['datet'])
    timest[10] = 'T'
    timest.append('Z')
    tS = "".join(timest)
    sData = {"timestamp":tS,"shape":notA.loc[i]['shape'],"posted":notA.loc[i]['posted'],"dur":notA.loc[i]['duration..seconds.'],"dur_text":notA.loc[i]['duration..hours.min.'],"geo":[notA.loc[i]['longitude'],notA.loc[i]['latitude']],'city':notA.loc[i]['city'],'state':notA.loc[i]['state'],"country":notA.loc[i]['country'],"comment":notA.loc[i]['text']}
    resq = requests.post(baseUrl+indexN+'/external/'+str(i)+"?pretty",headers=headers,data=json.dumps(sData))
    sucS += " " + str(resq.status_code) #+ resq.text
    if i%20 == 0:
        print sucS
        sucS = ""
python script for elastic search population
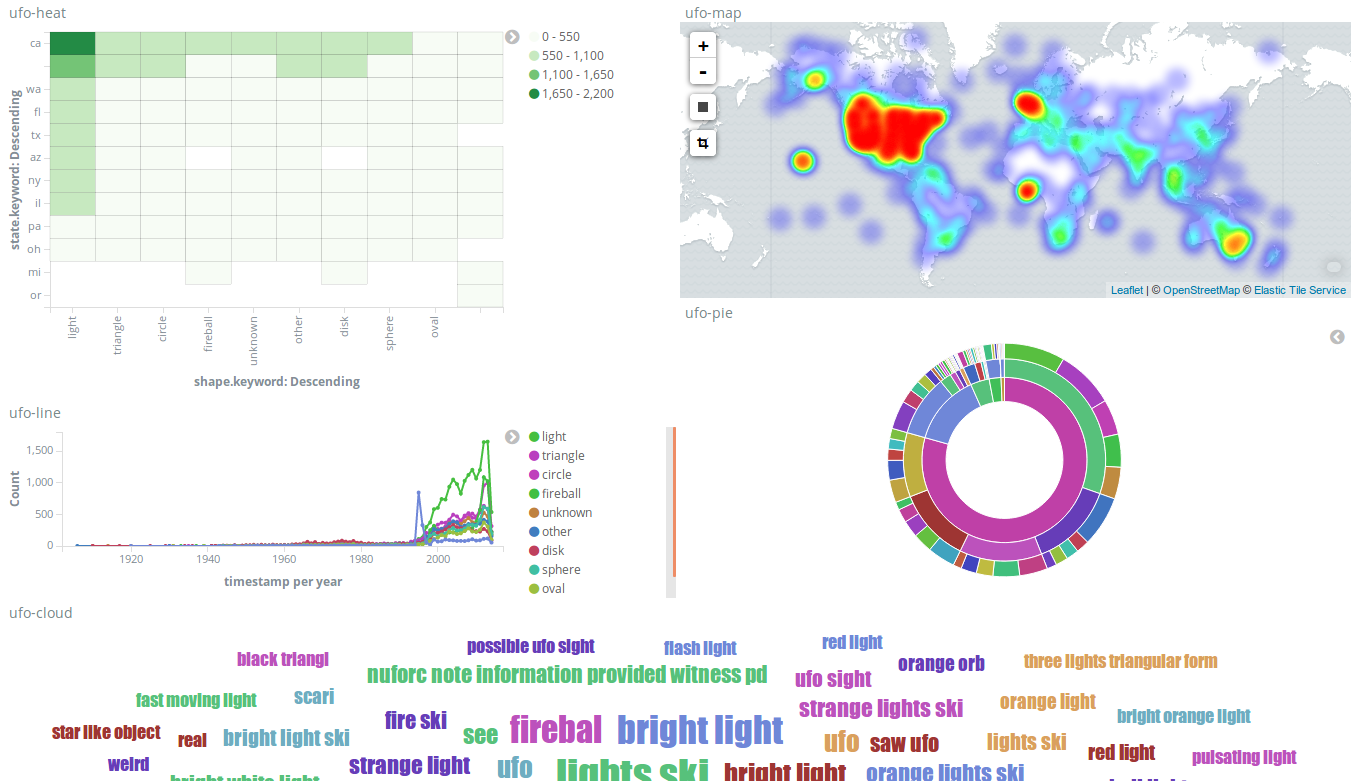
configuration in kibana


