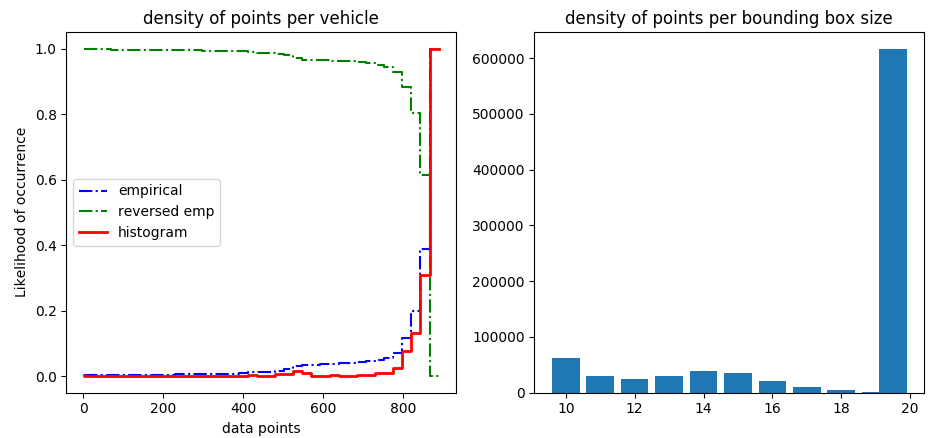
 regular distribution of data point per scooter (lhs), size of area with equal number of scooters, most of the scooters are in concentrated in high density areas (rhs)
Here is presented the solution for the assesment about scooter shift during the night.
map showing the areas of maximum shifts, explanation below
The procedure consists in defining:
The main focus of this project is mainly given to conviniently define the shift areas (where the shift is more than a 'customer walk') with the least scooter shuffling.
You are working in a disrupting digital company, that has a fast growth customer base. Users like your app and your scooters but have problems finding scooters at the right time and place when they need them. The backend team has provided you with the position logs (vienna_scooter_positions.csv downloadable via greenhouse) of all scooters in Vienna for one day.
The operations team has asked you to find out where they should place scooters in morning based on the position data of our scooters.
You have been tasked to create a solution which will satisfy all the demands of the different teams.
What do you do?
First of all we load the data and run simple statistics to understand data quality and distribution using this script.
We see that we have 6 digits coordinates which is in the meter resolution range and we build a spatial index, which we call octree, to distributes scooters in equal populated areas.
This index is a single string which contains 4 values: latitude, longitude, latitude resolution and longitude resolution. The number of digits sets the resolution, in this case we use 20 digits.
precDigit = 20 #truncated input, no further precision possible, range of meters
x = pos.iloc[0]
res = g_o.decode(g_o.encode(x['lon'],x['lat'],precision=precDigit,BoundBox=BBox))
print(res[2],x['lon'])
geo = gpd.read_file(baseDir + "gis/boxes.geojson")
BBox = list(geo.loc[geo['iso3166']=='AT',"geometry"].values[0].bounds)
pos.loc[:,'octree'] = pos.apply(lambda x: g_o.encode(x['lon'],x['lat'],precision=precDigit,BoundBox=BBox),axis=1)
We can therefore remove digits and coarse up the geometry to identify areas with equal number of scooters.
for i in range(10):
    setL = dens['n'] < 30.
    dens.loc[:,"oct2"] = dens['octree']
    dens.loc[setL,"octree"] = dens.loc[setL,'oct2'].apply(lambda x: x[:(precDigit-i-1)])
    dens = dens.groupby(['octree','hour']).apply(clampF).reset_index()
We can build trajectories starting from pivoting the position information on the scooter id.
def clampF(x):
    return pd.Series({"t":list(x['t']),"g":list(x['octree'])})
traj = pos.groupby('id').apply(clampF).reset_index()
traj.loc[:,"n"] = traj.apply(lambda x: len(x['t']),axis=1)
We than realize there are around 1000 scooters in the city with around 900 points per scooter which is a high density of information. Timestamps are pretty similar but not equal across all scooters.
 regular distribution of data point per scooter (lhs), size of area with equal number of scooters, most of the scooters are in concentrated in high density areas (rhs)
We coarsen the geometry until 12 digits to define around 1000 areas of interest with minimum edge of 100 meters.
First we visualize the areas with the largest number of scooters using this script.
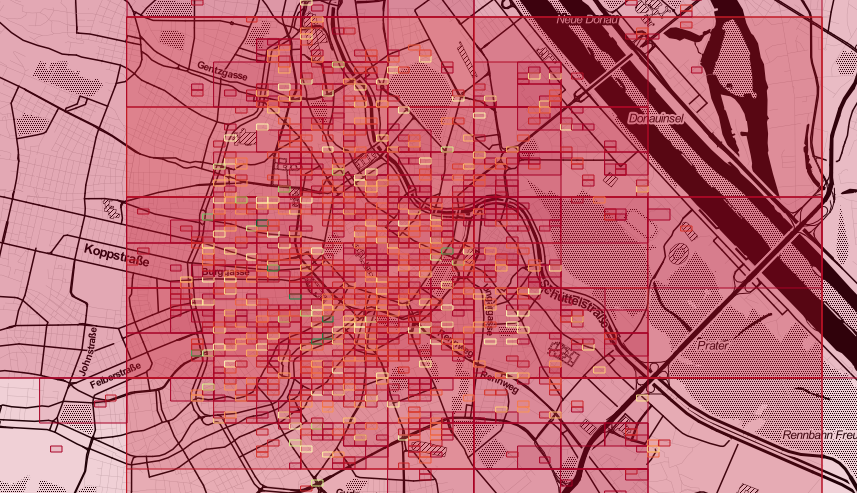 definition of areas for scooter population (red small, green high)
We see that most of the areas are described by the smallest resolution areas and we display only those:
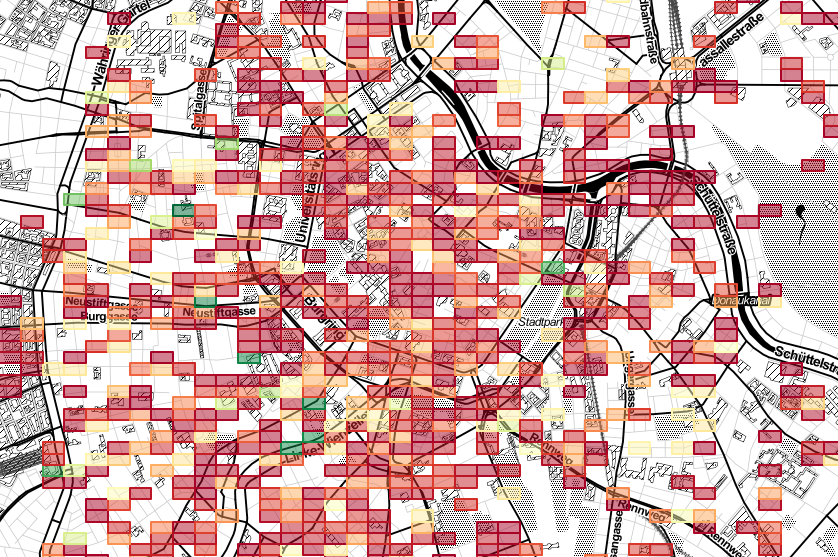 definition of areas for scooter population, small areas
We can than define the areas with largest morning population (h<8).
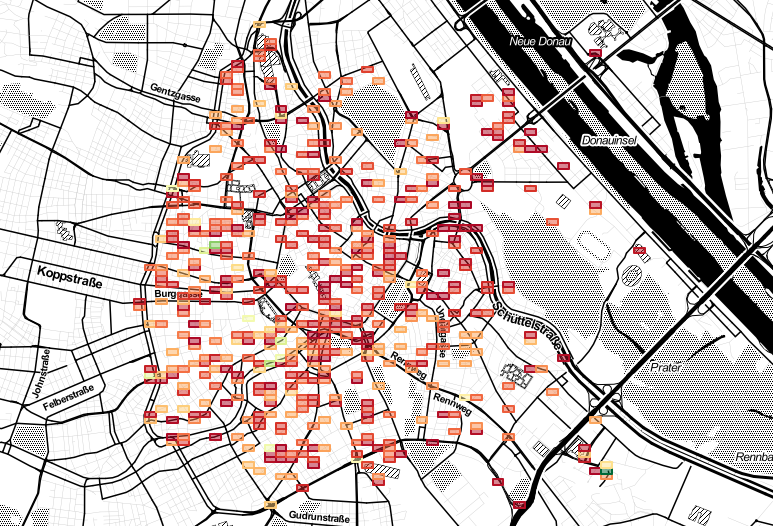 definition of areas for scooter population, morning
And the areas with the the largest evening population (h>18).
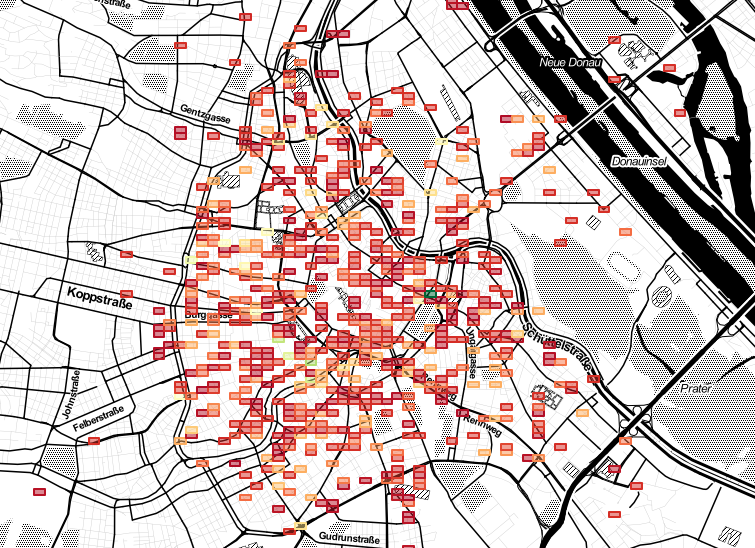 definition of areas for scooter population, evening
We can than merge the two dataframe and compute the difference.
We show at the distribution of shifts on the different areas
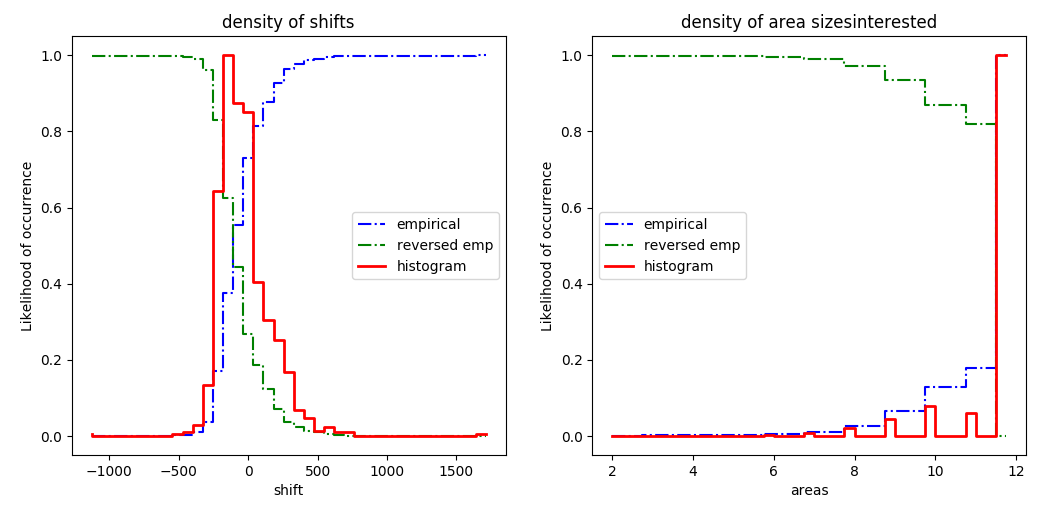 distribution of shifts from morning to evening for the same areas and density of areas sizes
and decide to bin the colors depending on a binning function with a special treatment for outliers.
def binOutlier(y,nBin=6,threshold=3.5):
    """bin with special treatment for the outliers"""
    n = nBin
    ybin = [threshold] + [x*100./float(n-1) for x in range(1,n-1)] + [100.-threshold]
    pbin = np.unique(np.nanpercentile(y,ybin))
    n = min(n,pbin.shape[0])
    delta = (pbin[n-1]-pbin[0])/float(n-1)
    pbin = [np.nanmin(y).min()] + [x*delta + pbin[0] for x in range(n)] + [np.nanmax(y).max()]
    if False:
        plt.hist(y,fill=False,color="red")
        plt.hist(y,fill=False,bins=pbin,color="blue")
        plt.show()
        sigma = np.std(y) - np.mean(y)
    t = np.array(pd.cut(y,bins=np.unique(pbin),labels=range(len(np.unique(pbin))-1),right=True,include_lowest=True))
    t[np.isnan(t)] = -1
    t = np.asarray(t,dtype=int)
    return t, pbin
We can than display the regions where the largest shift appear
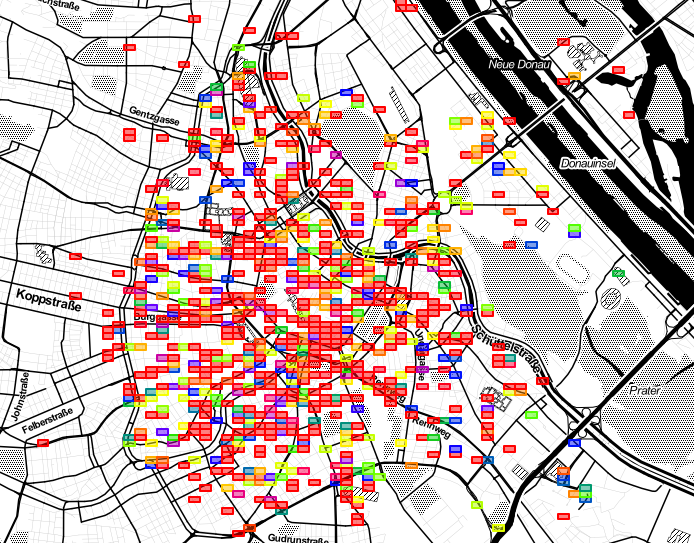 definition of areas for scooter population, morninig-evening differencen
We now run the inverse transformation for grouping areas where the total shift is smaller than 30
for i in range(10):
    setL = dens['n'].abs() > 30.
    if sum(setL) == 0:
        break
    dens.loc[:,"oct2"] = dens['octree']
    dens.loc[setL,"octree"] = dens.loc[setL,'oct2'].apply(lambda x: x[:(precDigit-i-1)])
dens = dens.groupby(['octree','hour']).apply(clampF).reset_index()
We set this empirical parameter by now as 30 to take into consideration daily deviations of:
And we can see the minumum size of areas where at least 30 scooters have to me replaced during the night
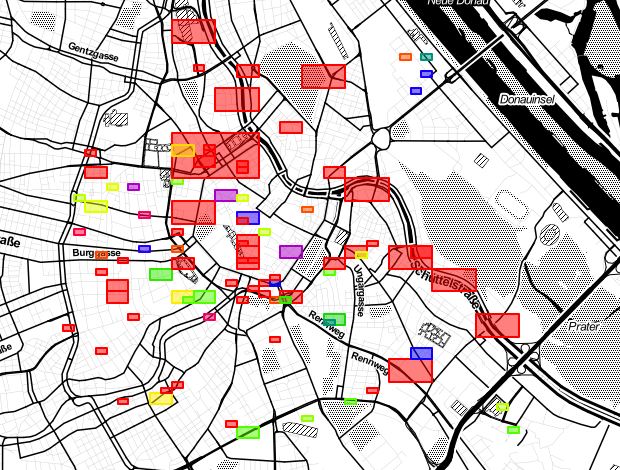 definition of areas for scooter population
Deciding the tollerance of the smallest area night shifts can be planned reducing the occupation of personal during the night.
Now we look for a trade of between:
Let's say we consider worth reshuffling the scooter from areas with size between 5 and 11 digits.
We don't want huge areas (not valuable), we don't want small areas (within a customer walk).
30 scooters should be than moved every night inside this area referrint to this geometry
We also created a table with the numbers and positions for deployment where a given quantity of scooter should be randomly allocated inside this area.
Data are displayed in this format:
| octree | quantity | x | y | dx | dy |
|---|---|---|---|---|---|
| 4241343 | 28.0 | 16.356044 | 48.182606 | 0.029805 | 0.010345 |
| 424134334 | 29.0 | 16.348593 | 48.190365 | 0.007451 | 0.002586 |
In the folder there is a script for set up and a docker file for the container. The project can be containerized and deployed in production.
For each shift area we can find the best morning - evening area pair:
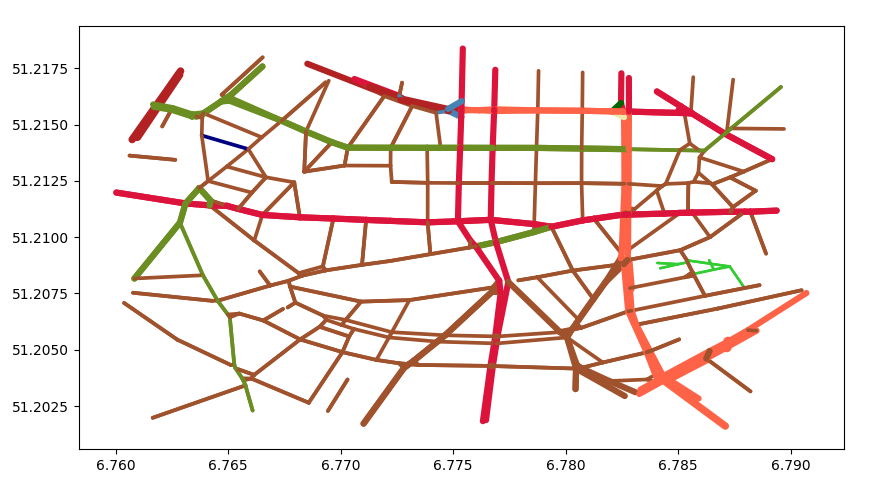 local network graph from openstreetmap
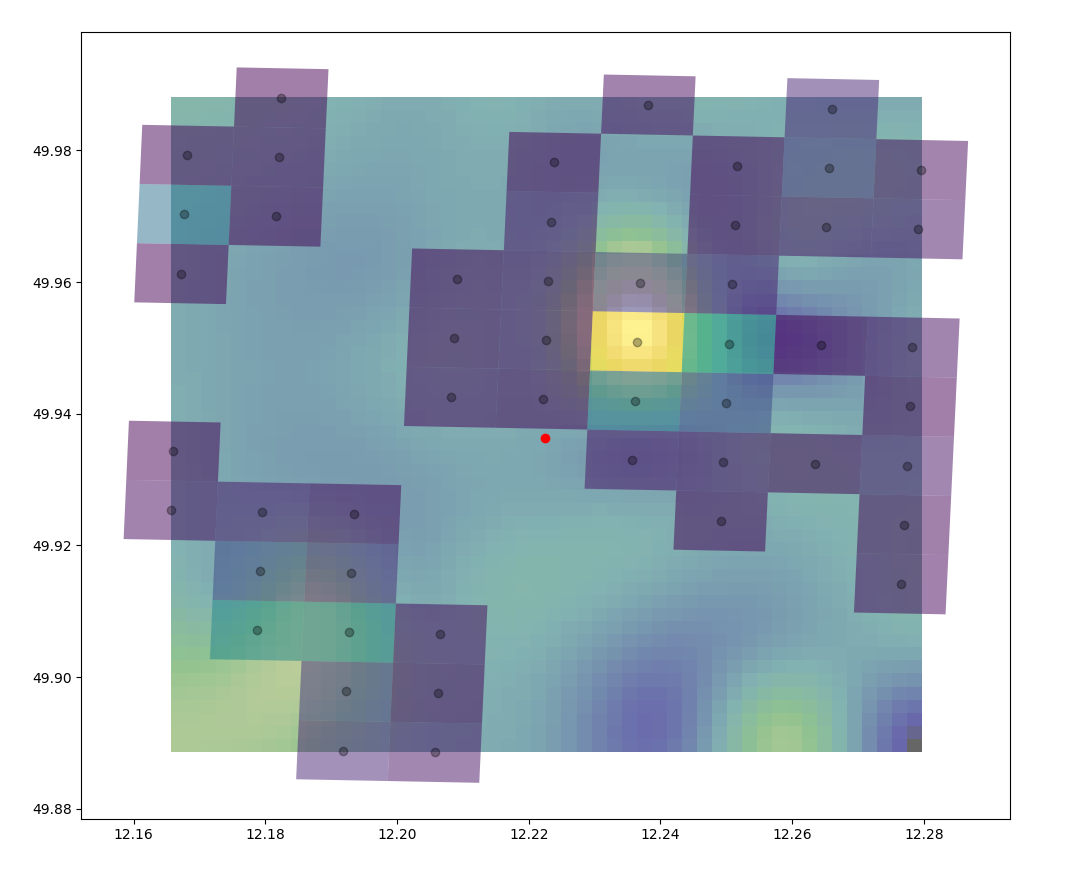 density interpolation within octrees
Octrees can be linked to city specific geometries.
Another option is to move from bounding box to Voronoi using the same octree index.
k means clustering to define the precise spots inside a shift area.
The point of the exercise is not to have you write the perfect solution, but rather for us to get a better feeling of your problem solving skills, your understanding of the dataset you are working with, your coding style, tooling choice and the way you present your solution.
This will make the following interviews much easier for you since you have already shown your technical skills in a realistic problem.
Description
Deliverables You will need to upload your code to greenhouse, along with instructions on installing and running your code and explanations of the choices you have made.
We need to be able to run your code (Python or similar, SQL, etc.), by following provided documentation, in order to validate the criteria of the challenge.
The minimum expected is a readme file, but the thorougher the documentation the better. We also expect you to provide the list of deployment positions in csv format and report how you addressed this problem and came up with these deployment positions for the operation team. You will get additional credit if you could detail how the solution can be enhanced.
Conditions You are allowed to use any programming language, framework, tool and library you want, unless explicitly mentioned not to. We highly advise picking the right tools to solve the problem, rather than just tooling you are used to.
Note: You are not allowed to use any code you might find online, neither to publish your solution or this document without our explicit consent.
For any questions that might arise, please contact Christoph at christoph.bernkopf@goflash.com.