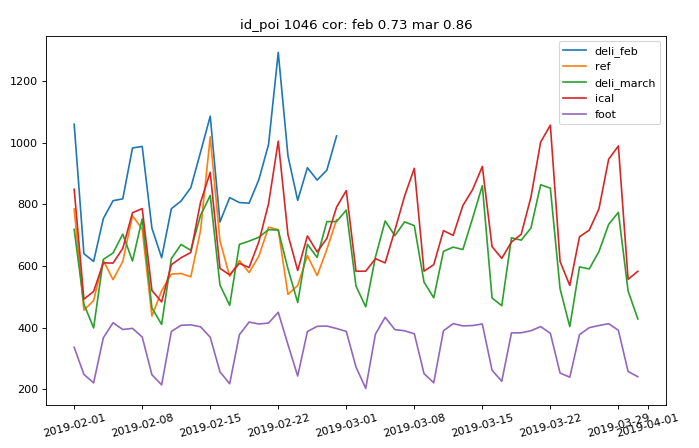
 delivery curves
This readme explains the content of the directory and the execution steps to complete the delivery forcasts.
 delivery curves
This project folder does not contain any script to retune or re perform a mapping or a prediction or run sanity checks, it just applies already pretrained models. In case of unconsistency please refer to the author.
In the project directory there is an example docker file for creating an ad hoc container.
 project directory
To install the basic libraries please run this script with python 3.6+. Depending on the required KPIs other graphic libraries might be installed.
All the scripts consider the variable $LAV_DIR which can be set as the current directory. Paths can be otherwise hard coded adjusted.
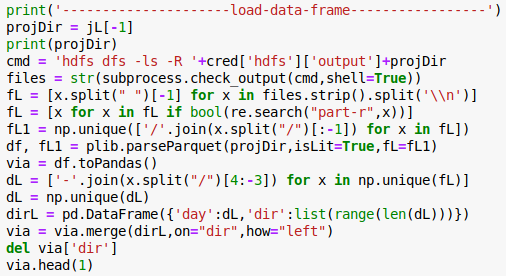 jupyter notebook on Hungarian cluster
 example of mapping result
Complete the date list in this file
apply this script to dowload the weather information for training
apply mapping with this script
apply prediction with this script on
 results after regression
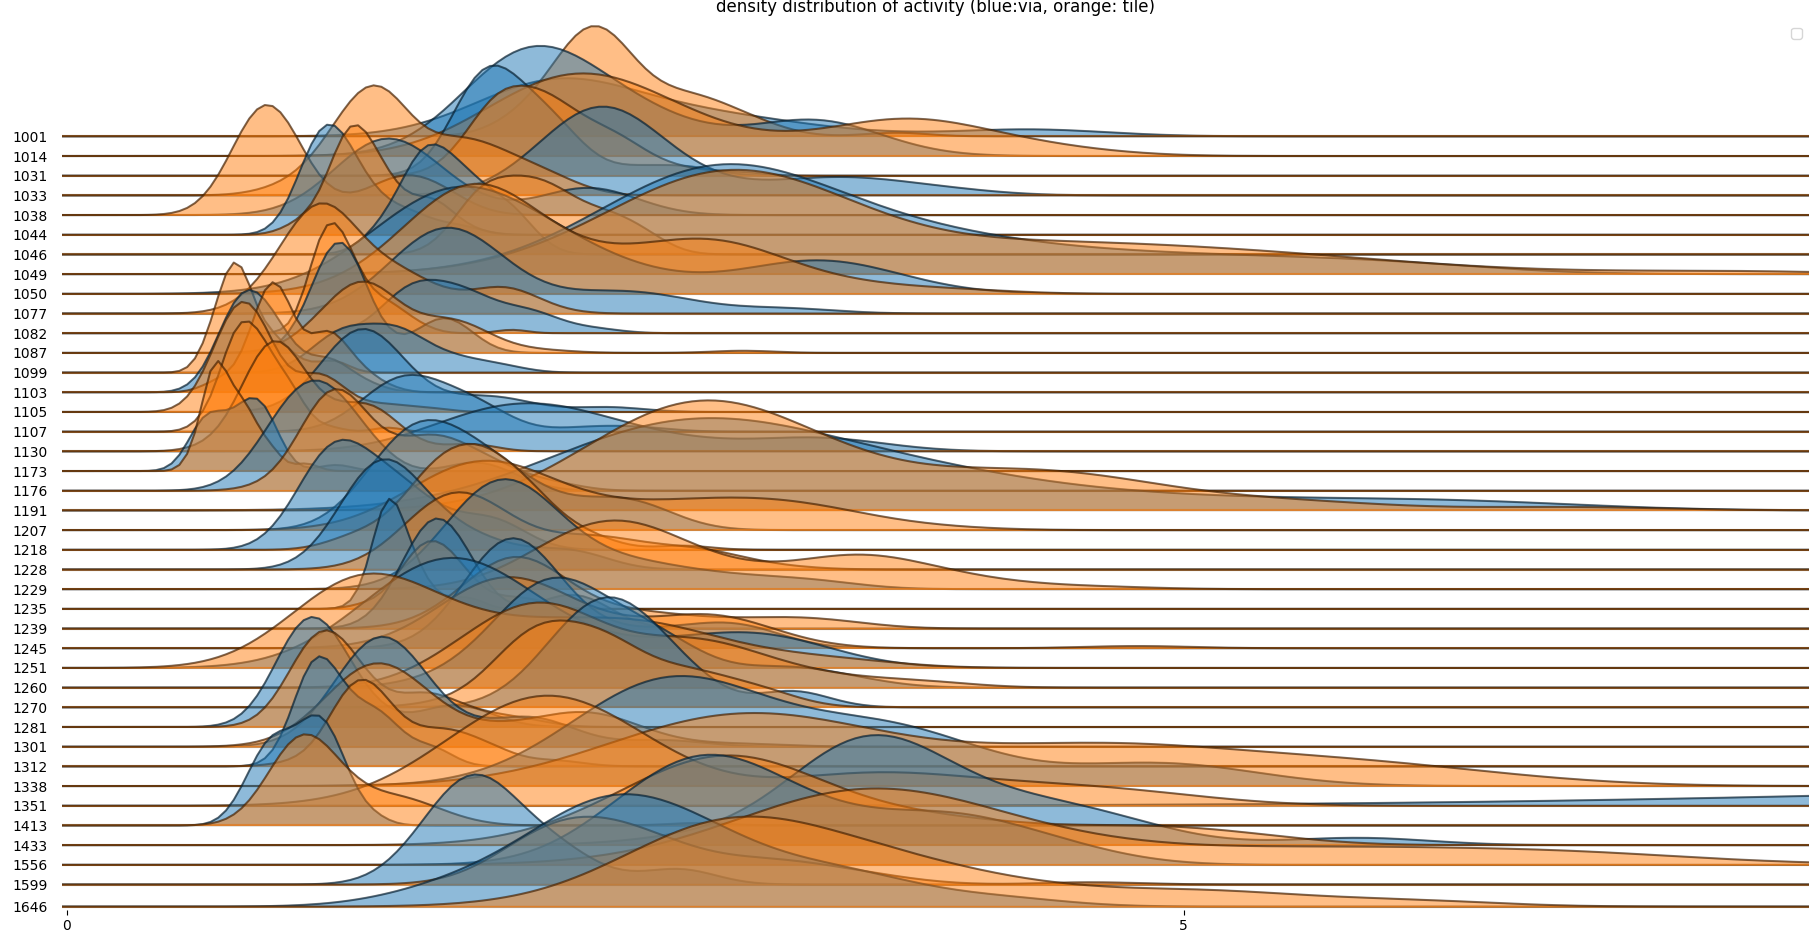 differences wrt previous delivery
Apply this script to sum up the results for the customer delivery and check the following KPIs:
 t-test feb-mar vs t-test mar-apr, change in ranking
 differences in capture rate between deliveries
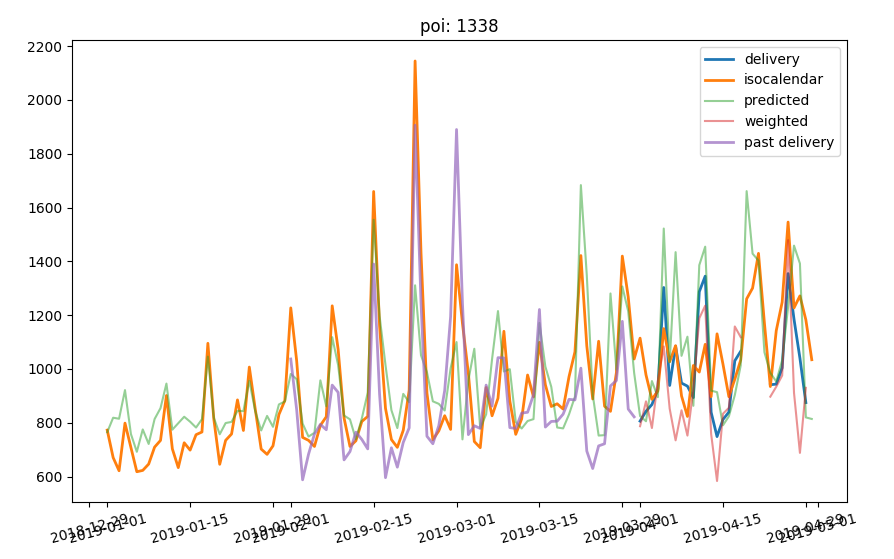
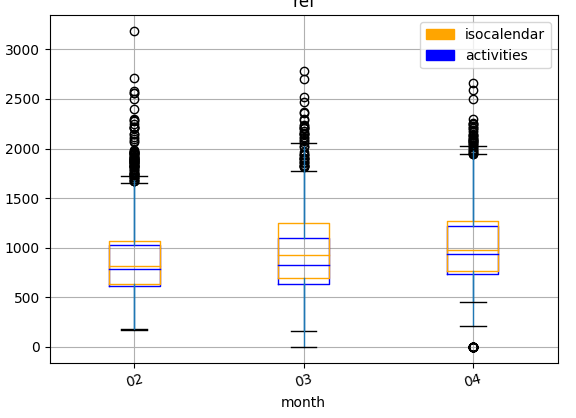 check against isocalender
Run the script tank_delivery adjusting the output file name.
 finalize the delivery
