 lernia library
Feature building from the lernia library
 lernia library
We collect weather data from darksky api
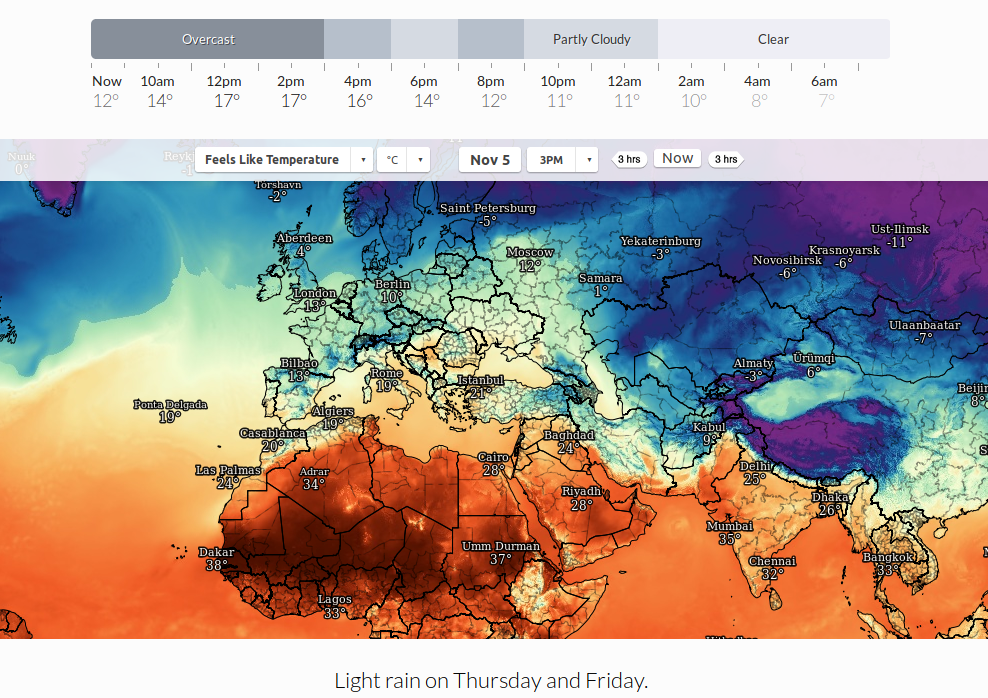 darksky weather api
And census data from eurostat
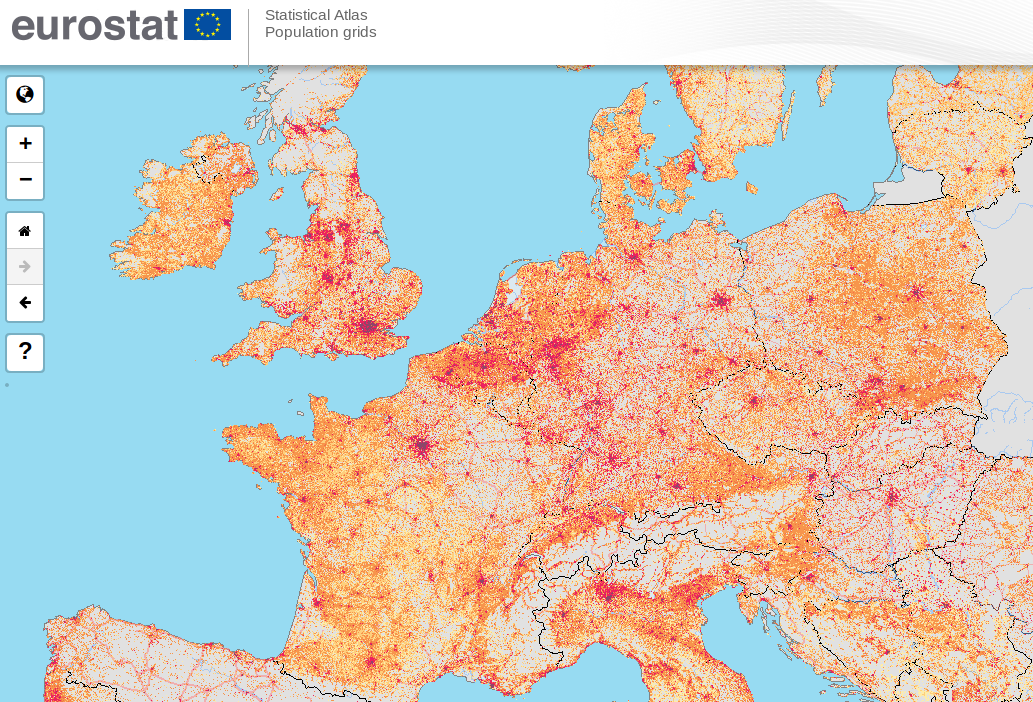 eurostat census data
For each feature is important to undestand statistical properties such as:
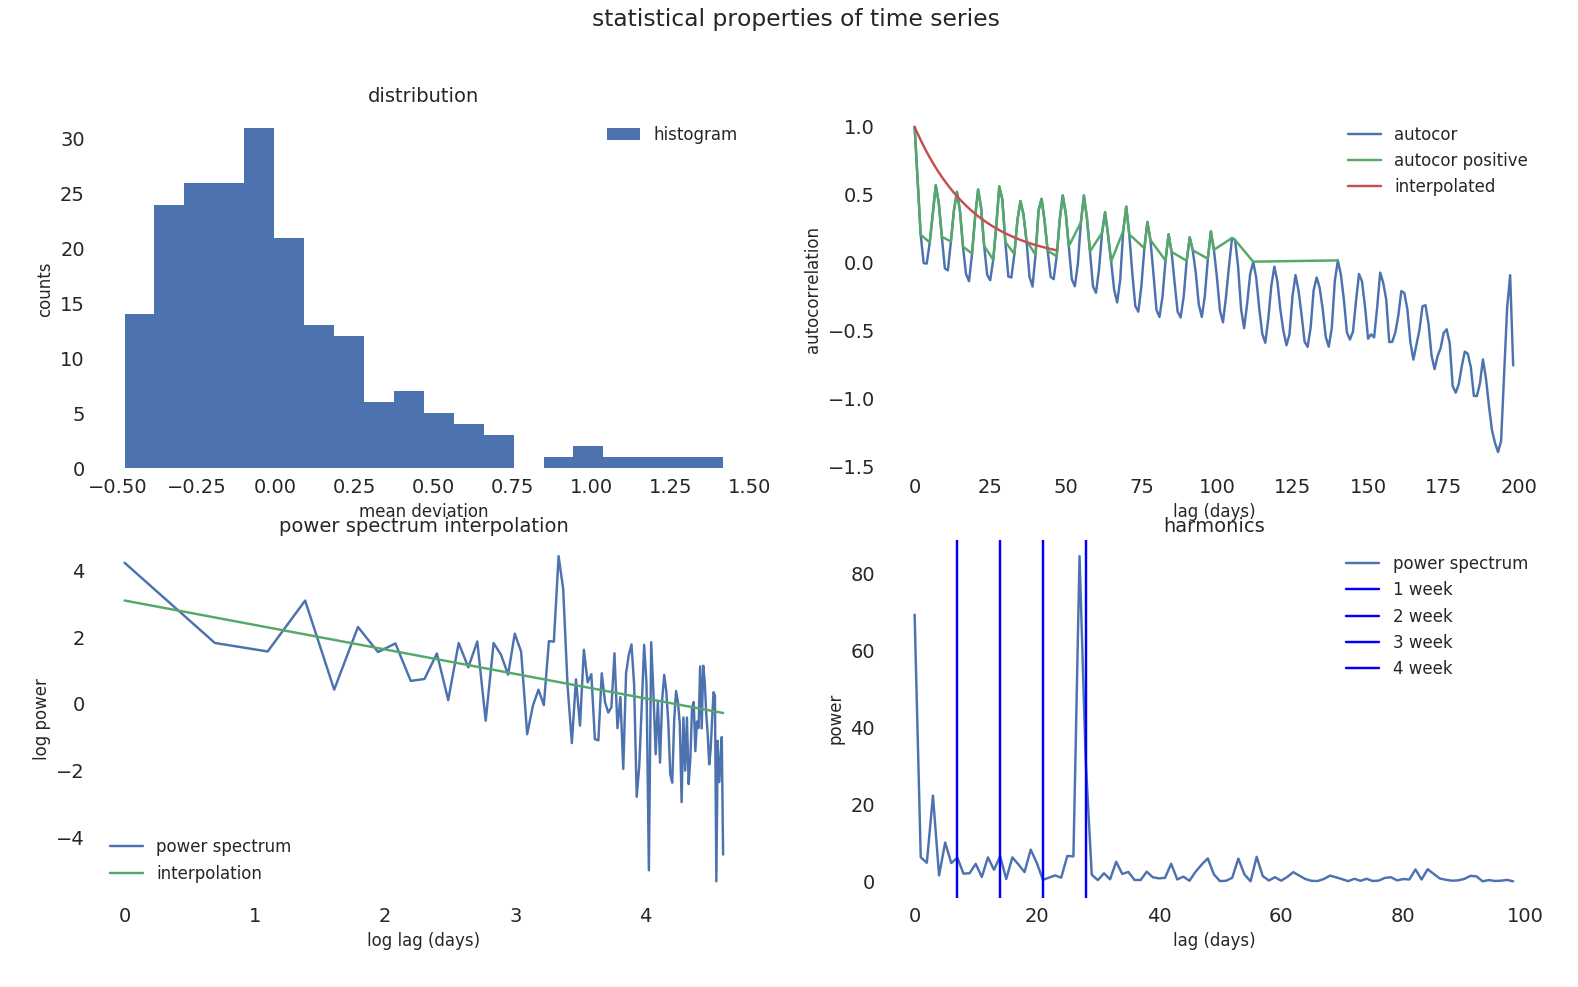 statistical properties of a time series
We should evaluate the distribution of each variable, this view is confusing
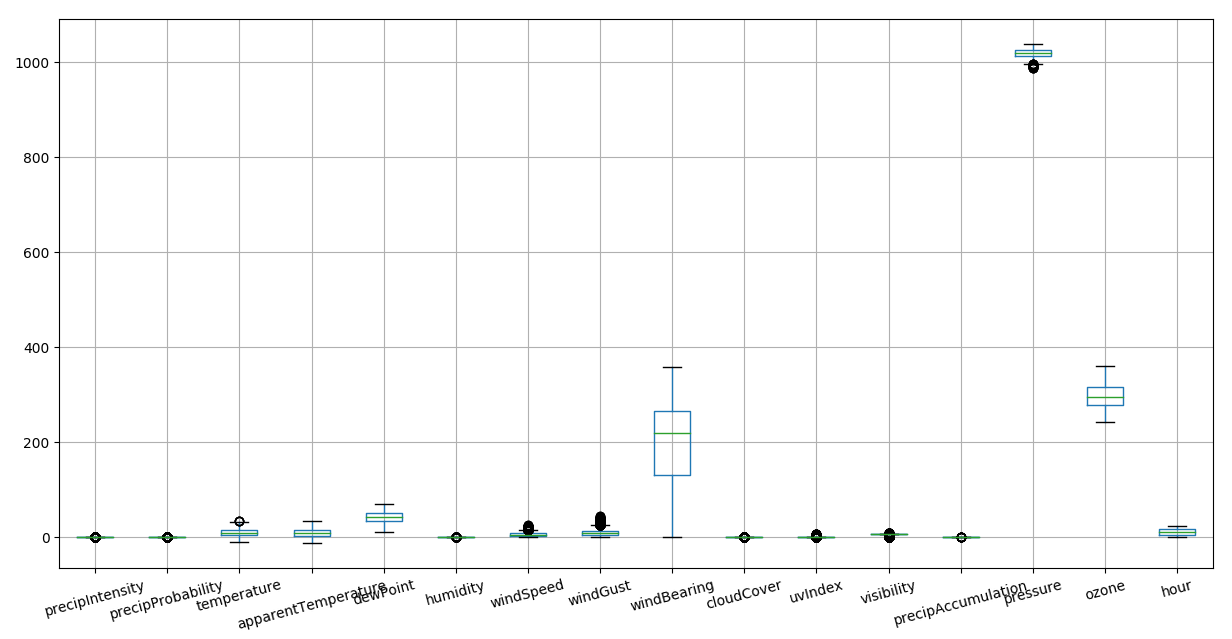 no norm
An important operation for model convergence and performances is to normalize data. We can than see in one view all variances and skweness
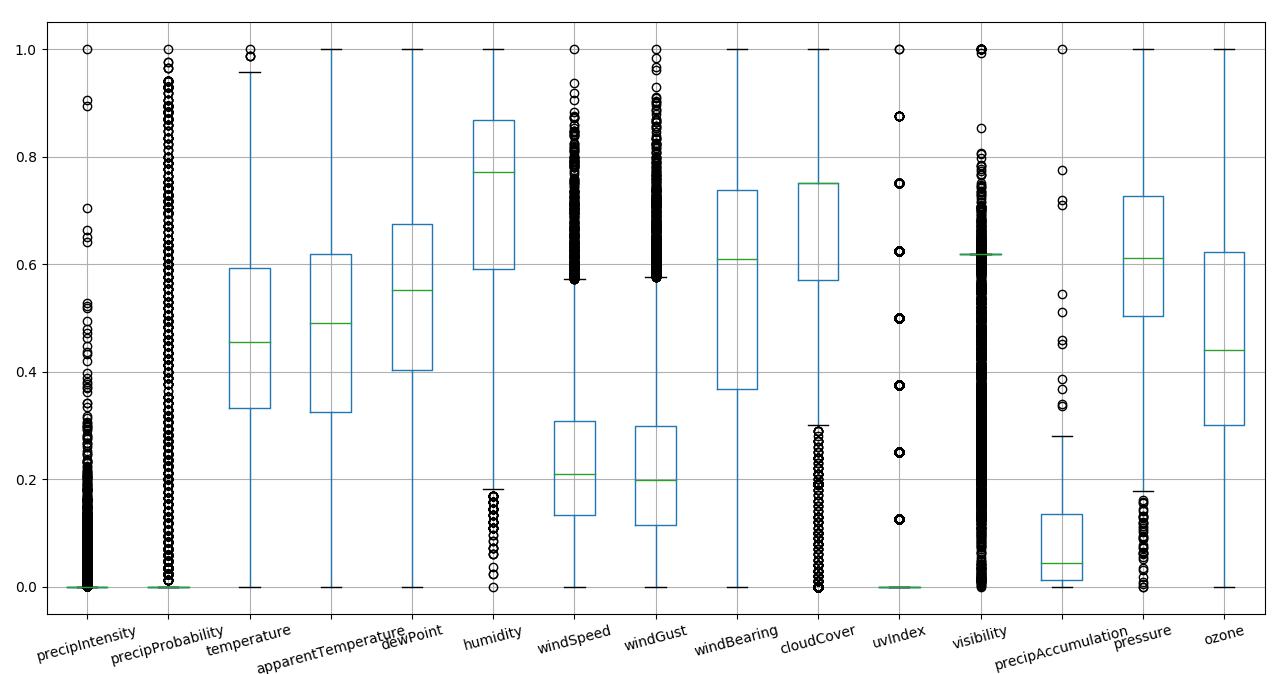 minmax norm
Outliers can completly skew the distribution of variables and make learning difficult, we therefore remove the extreme percentiles
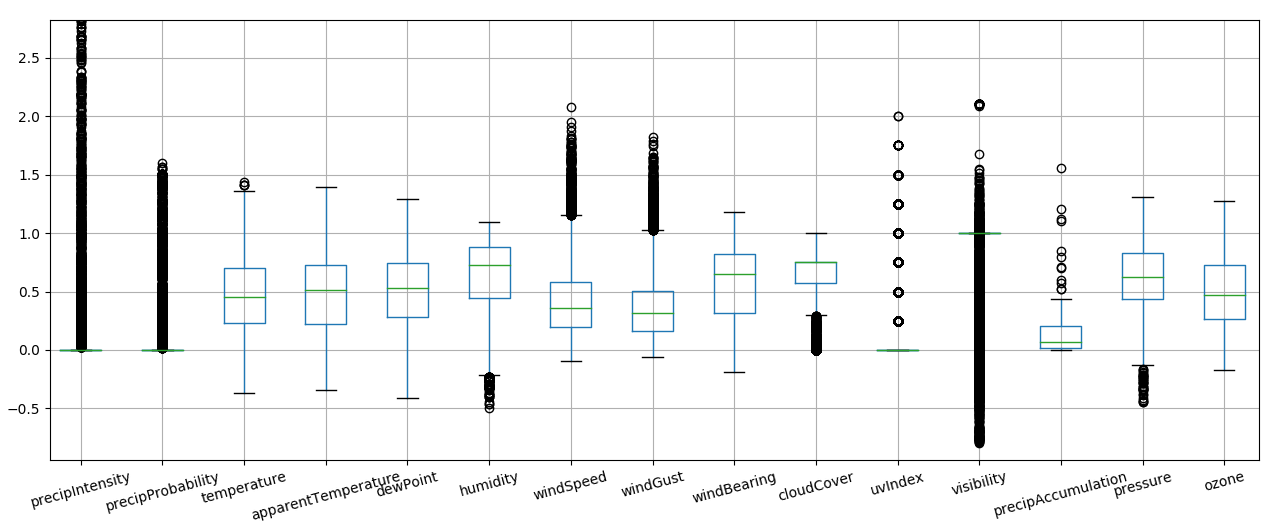 norm 5-95
We remove percentiles and normalize to one
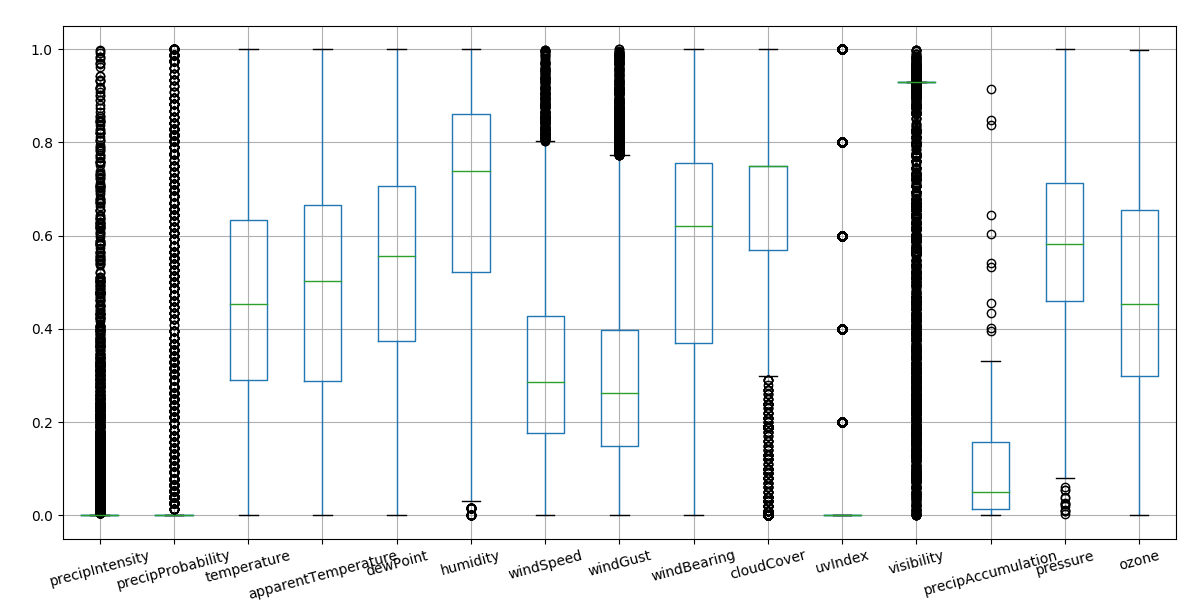 norm 1-99
Correlation between features is important to exclude features which are derivable
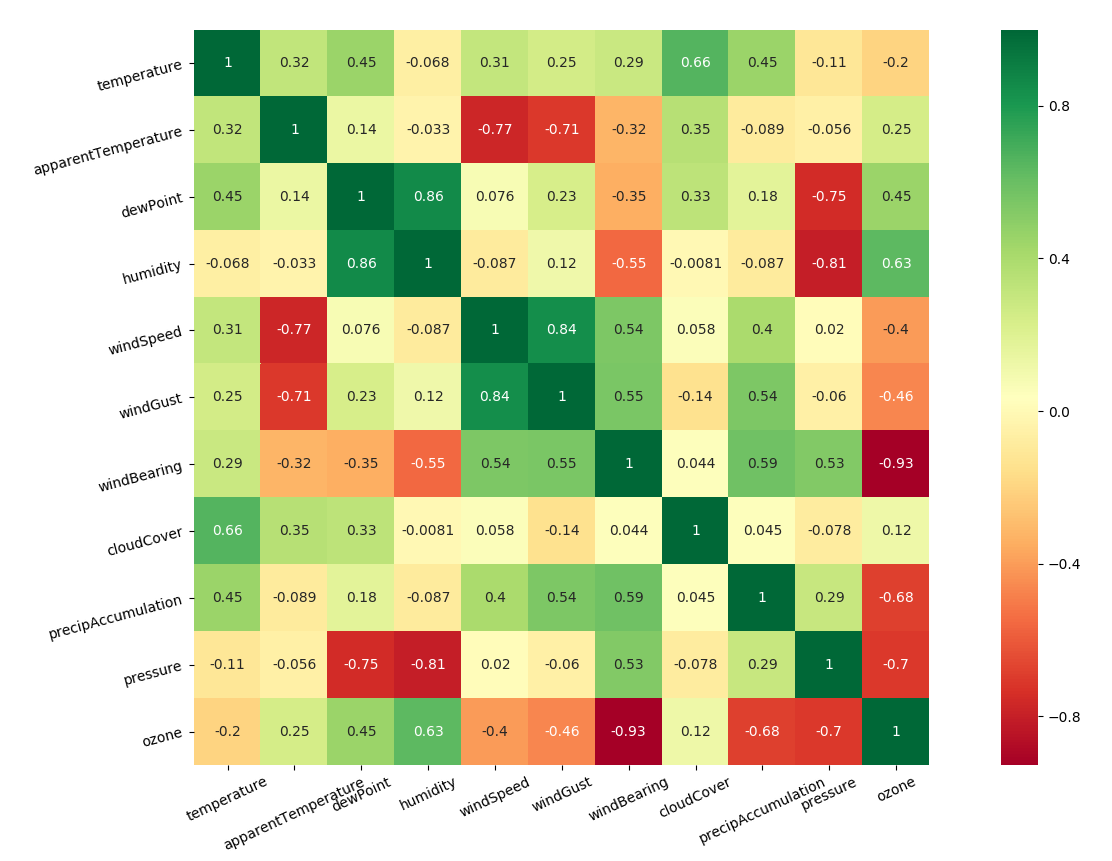 feature correlation
Outlier removal is not changing the correlation between features
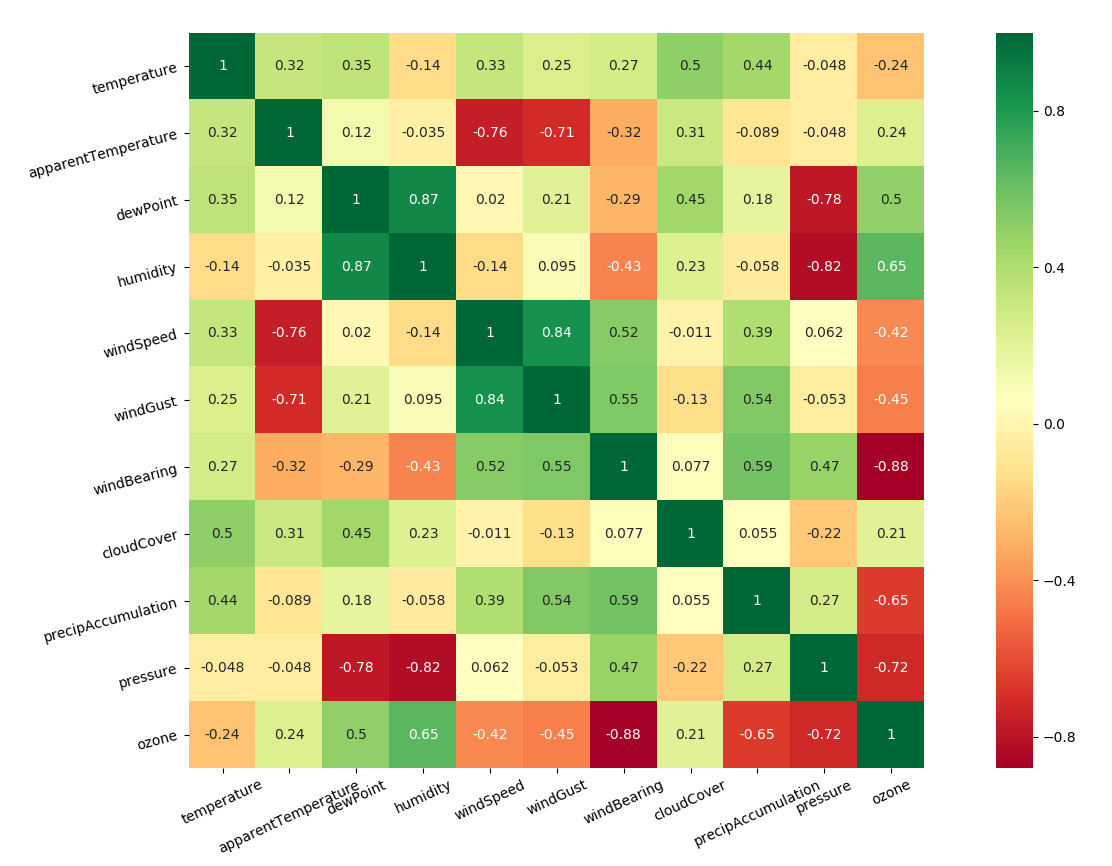 feature
correlation
Some features have too many outliers, we decide to put a threshold and transform the feature into a logistic variable
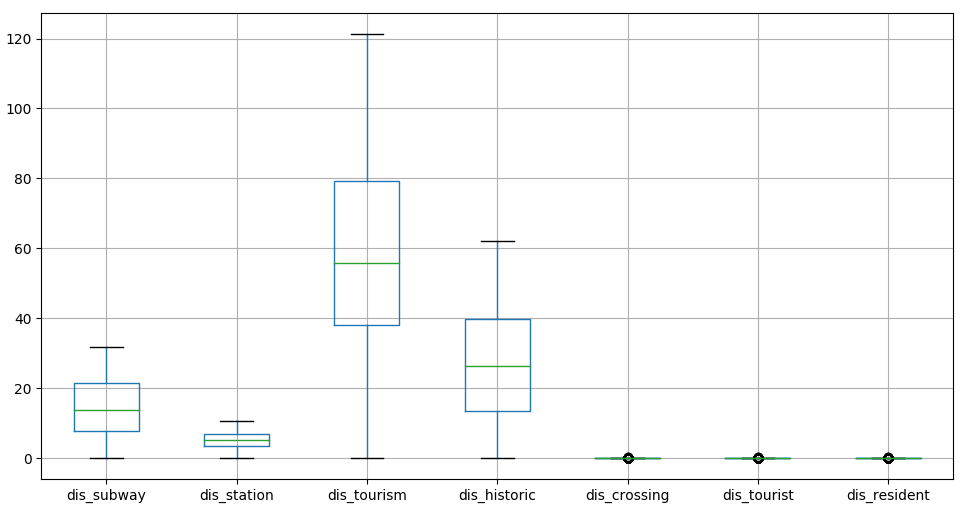 norm cat
Apart from boxplot is important to visualize data density and spot the multimodal distributions
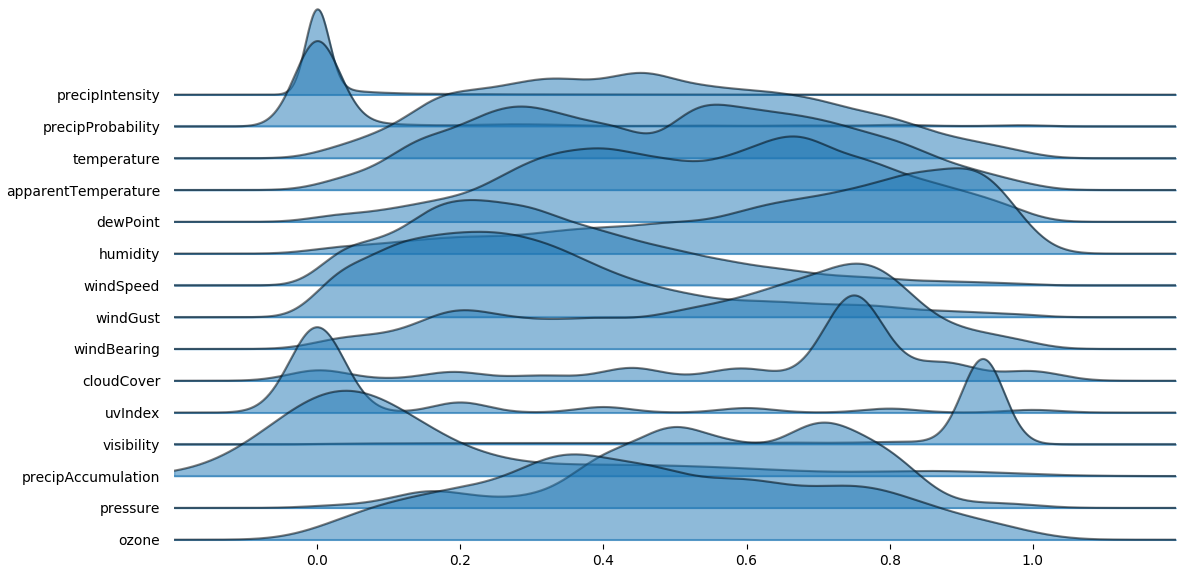 norm joyplot
We than sort the features and exclude highly skewed variables
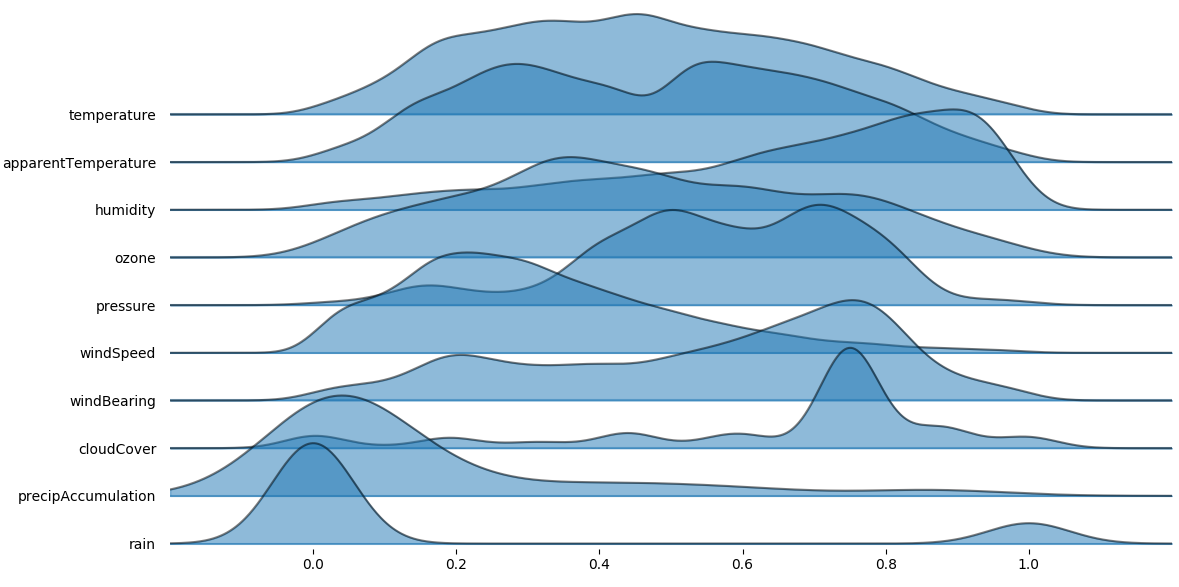 norm logistic features
Looking at the 2d cross correlation we understand a lot about interaction between features
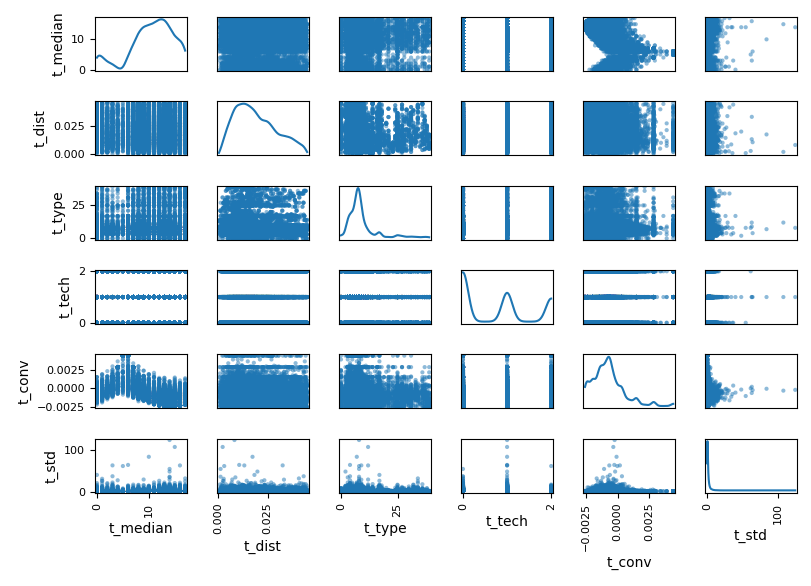 selected
features
And we can have a preliminary understanding about how features interacts
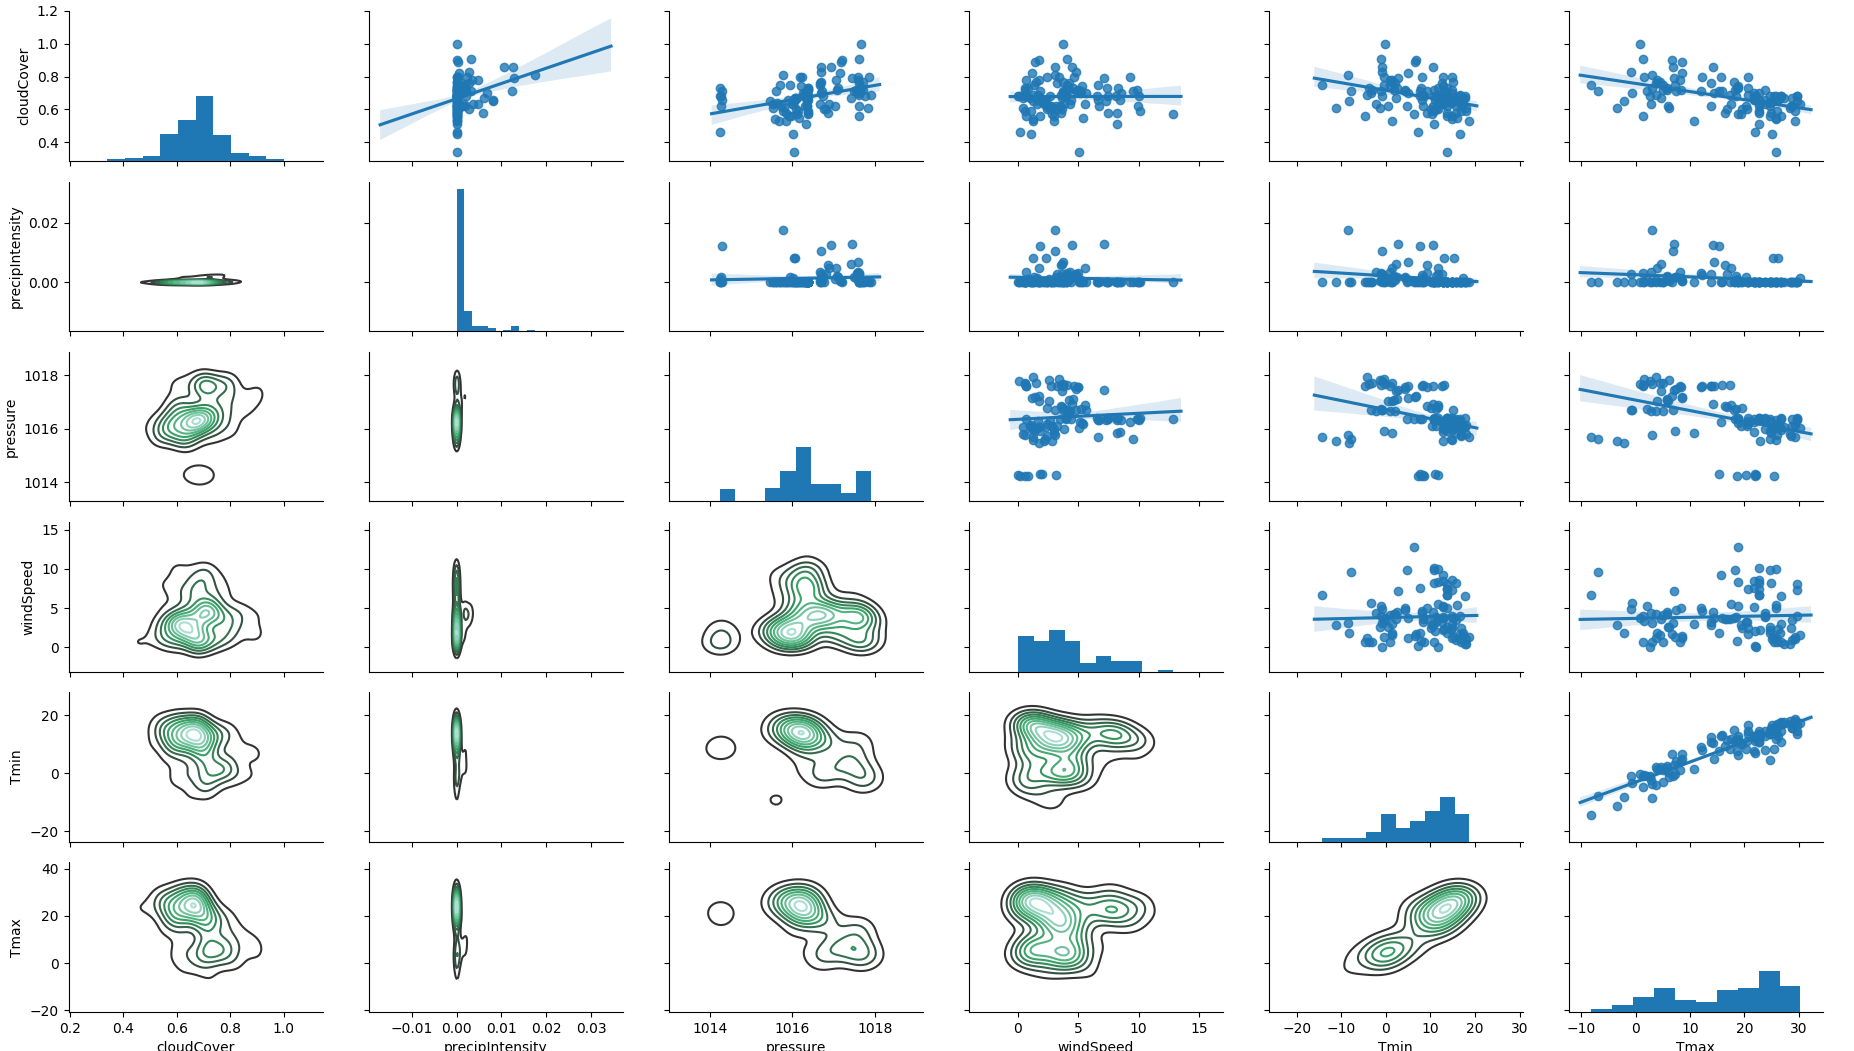 feature 2d
correlation
We know that apparent temperature is dependent from temperature, humidity, windSpeed, windBearing, cloudCover but we might not know why. Apparent temperature can be an important predictor so basically we can reduce the other components with a PCA
 pca on
derivate feature
Interestingly the first component explains most of the feature set but doesn’t explain the apparent temperature which is describes in the second component
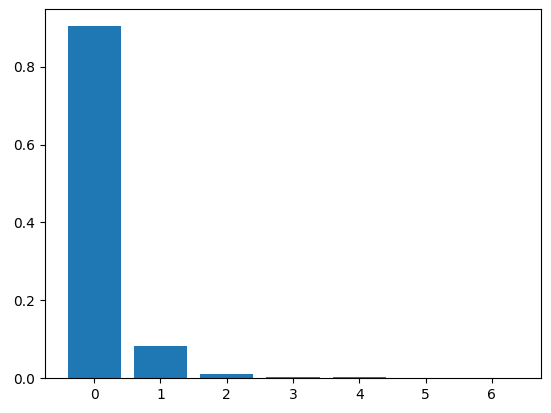 components importance
For the same components we can investigate other metrics
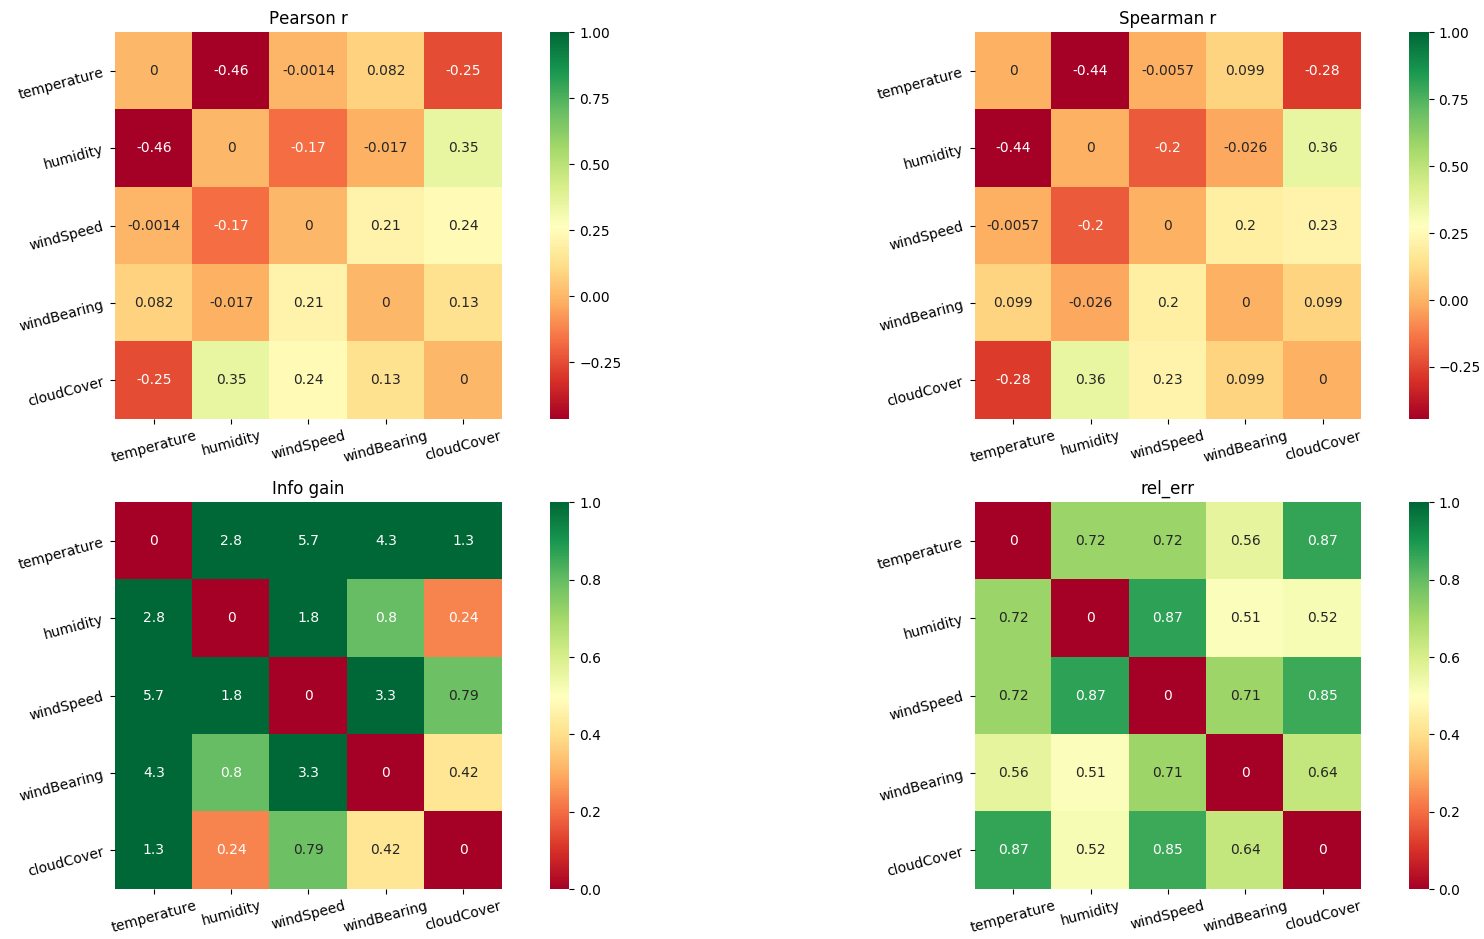 feature pair metrics
Working with python doesn’t leave many options, contrary to R almost any library return errors. We therfore interpolate or drop lines.
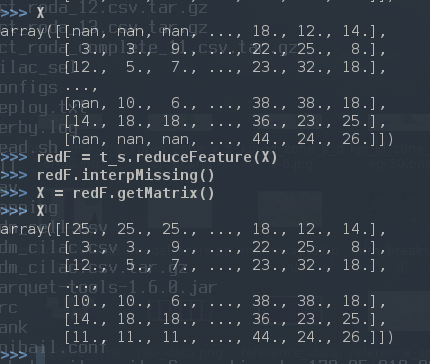 replacing nans with interpolation
The main issue with interpolation is at the boundary, special cases should be treated
If we have a lot of time series per location, or multiple signal superimposing we look at the chi square distribution to understand where outlier sequence windows are off
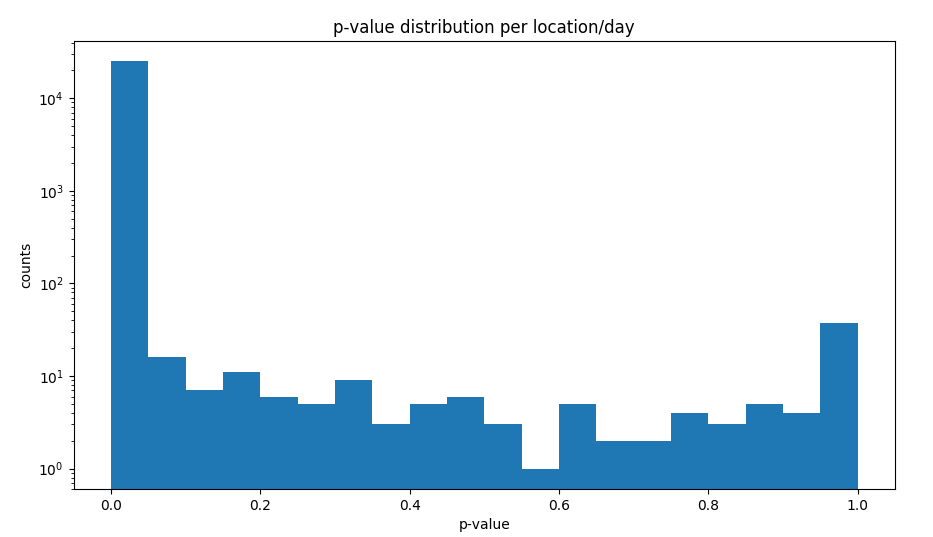 chi square
distribution
We than replace the off windows with a neighboring cluster
 replace volatile
sequences
Feature importance is a function that simple models return. Since models don’t agree on the same feature importance and production model will even come to much different conclusions.
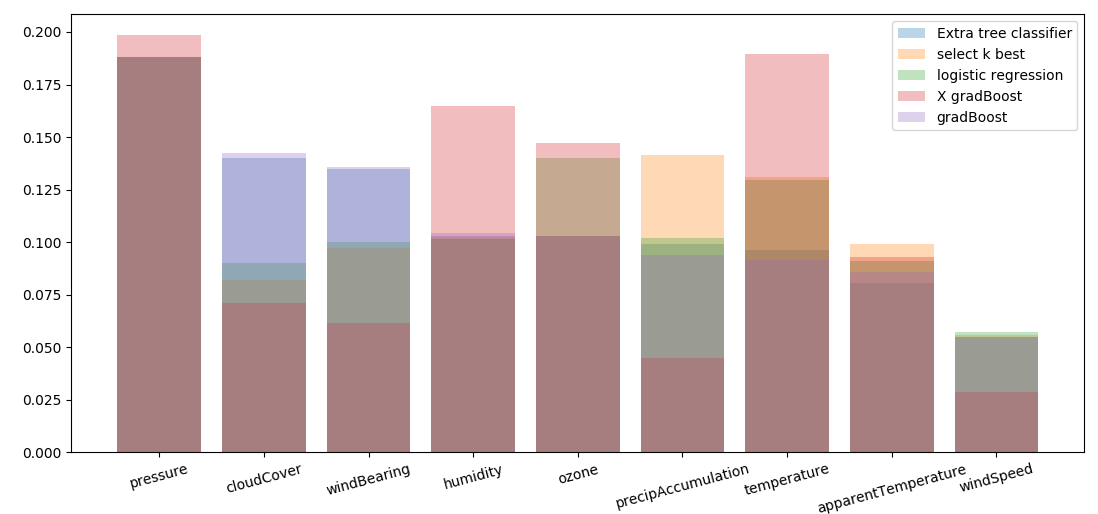 feature importance no norm
Normalization stabilize agreement between models
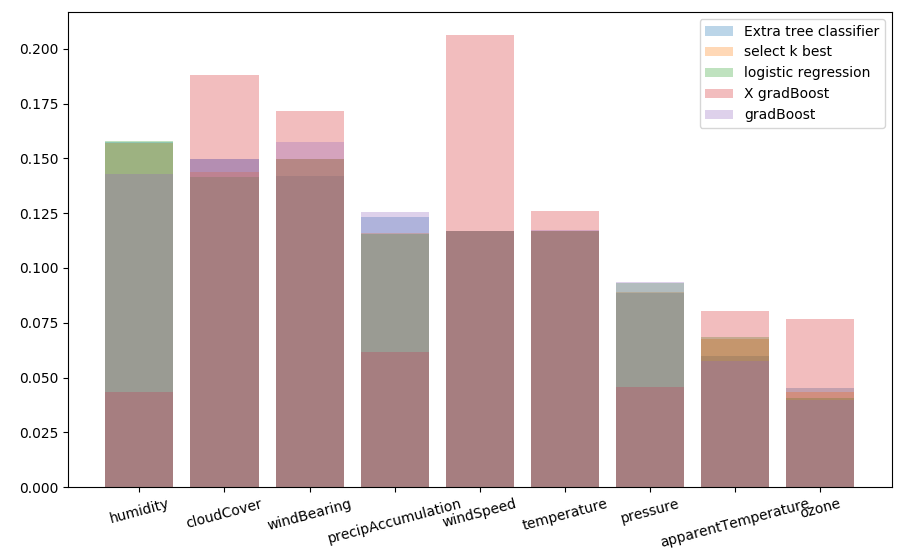 feature importance norm
We can apply as well a feature regularisation checking against a Lasso or a Ridge regression which features are relevant for the predicting variable
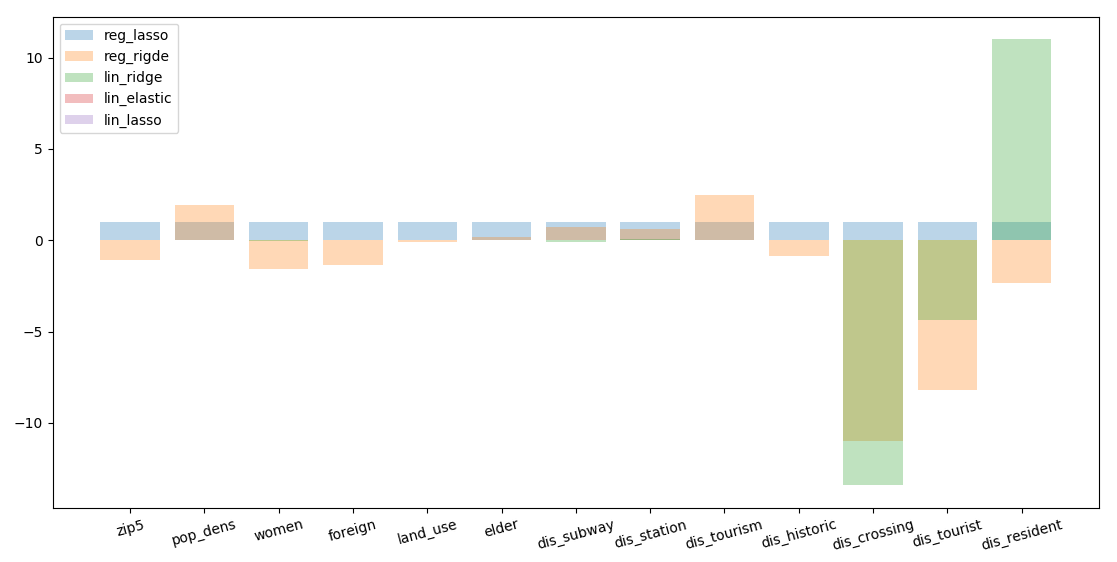 regularisation of features, mismatch in results depending on the
regressor
We than iterate model trainings removing one feature per time and calculate performaces. We can than understand how much is every feature important for the training
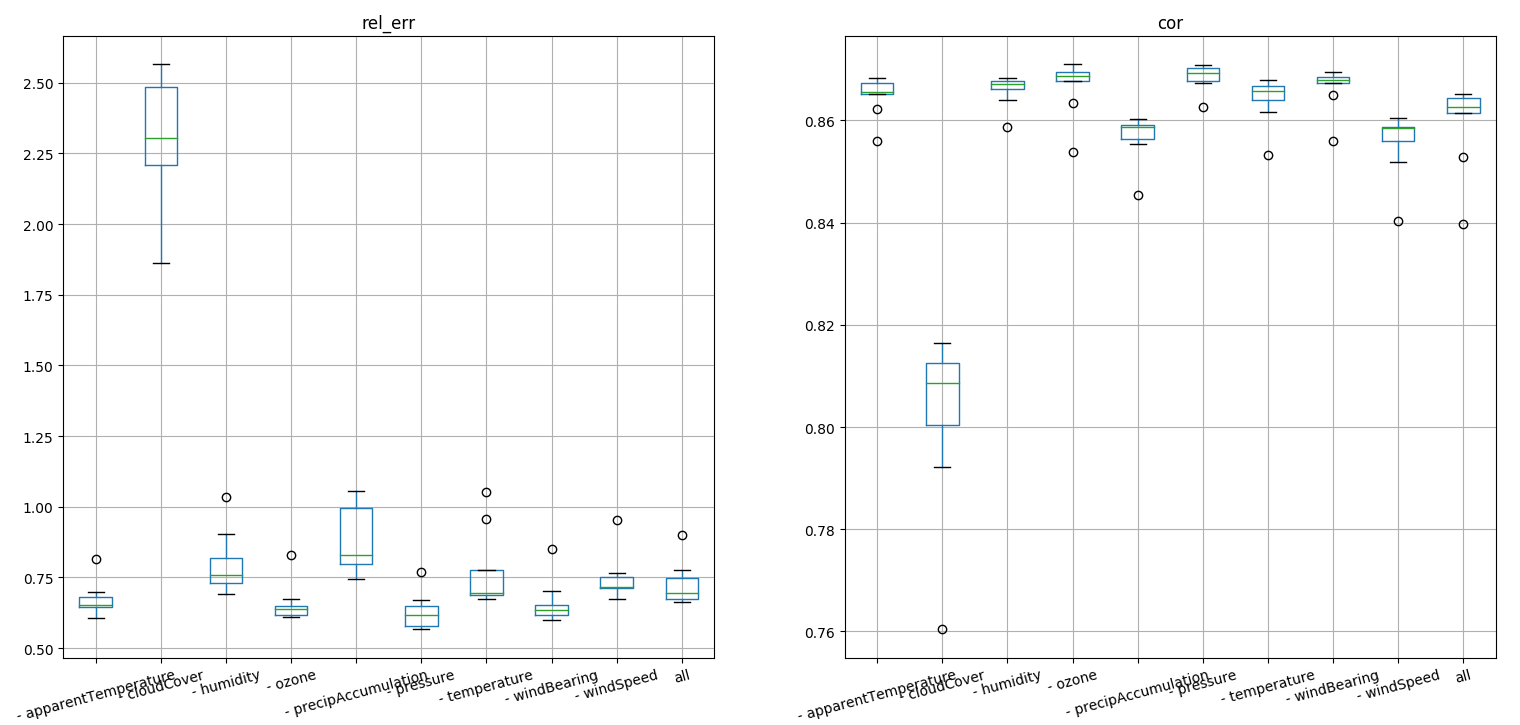 feature knock out
Strangely removing ozone and pressure the rain prediction suffers. We than analyze time series a realize a big gap in historical data and realize the few data where misleading for the model
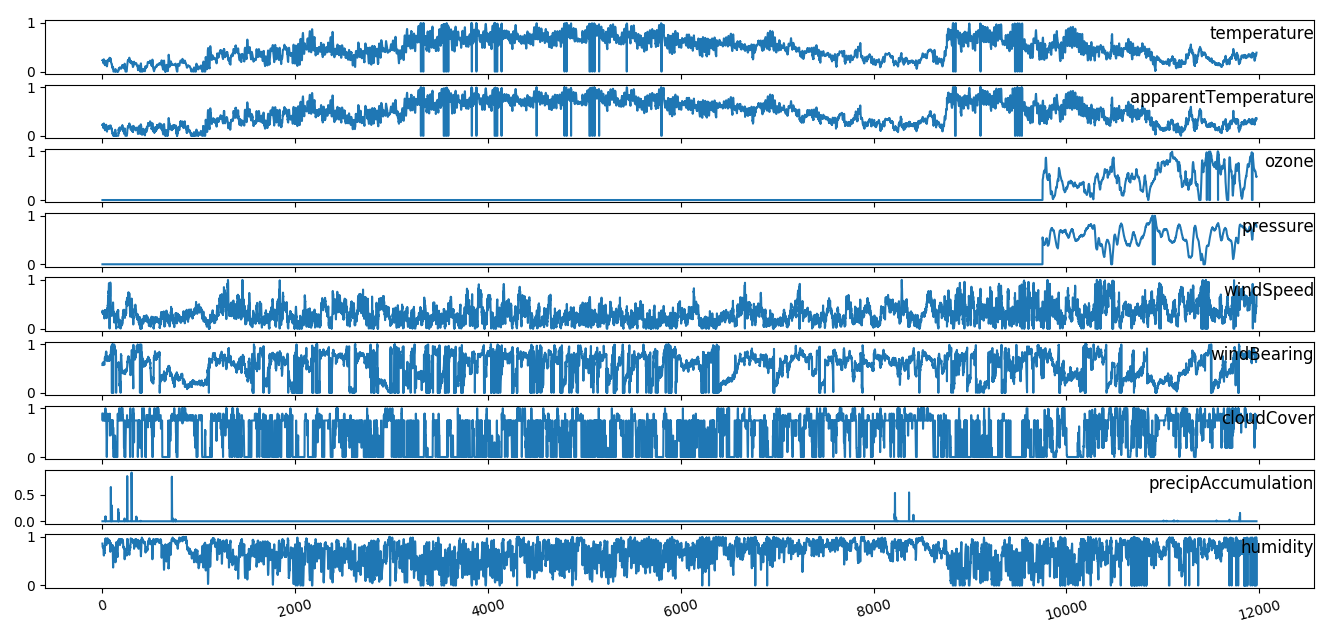 feature time series
The meaning of building features is to achieve good predictability, if we want to predict rain we have differences in performace between models
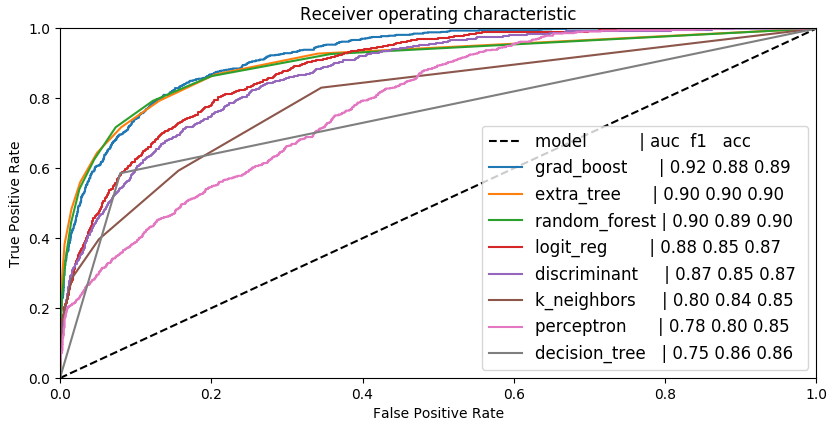 predictability, no norm
Cleaning features all the models perform basically the same
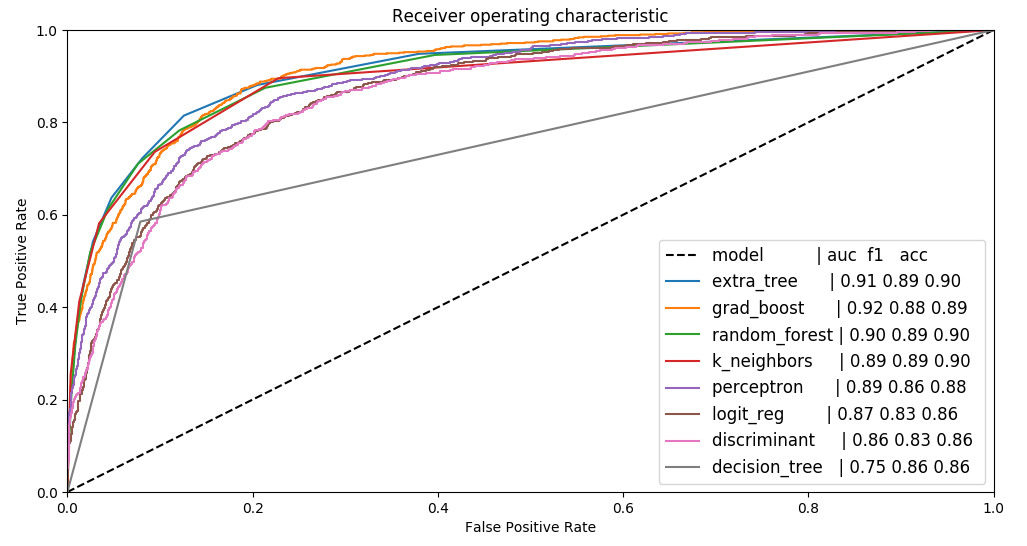 predictability, normed
Same if we train on spatial feature on a binned prediction variable
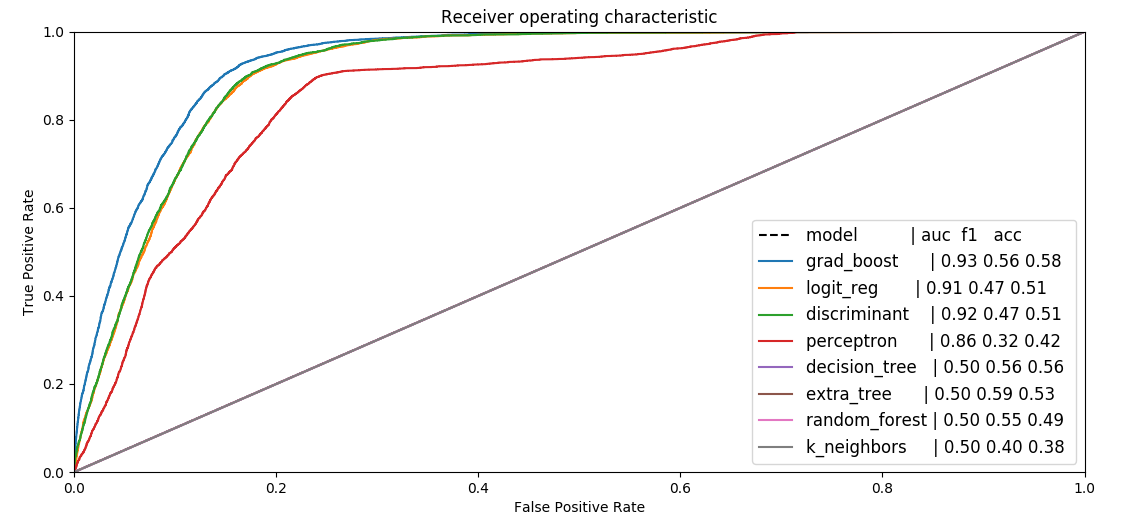 predictability, no norm
After feature cleaning we have better agreement between models
 predictability, normed
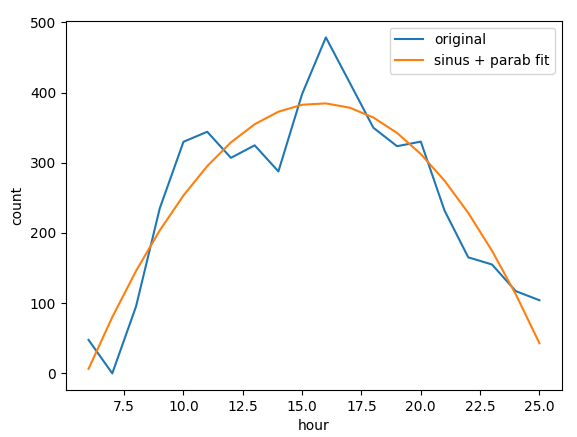
Detailed information can be compressed fitting curves
 simplify complexity
For a many day time series we can distinguish periods from trends
 simplify complexity
Time series can be transformed in pictures
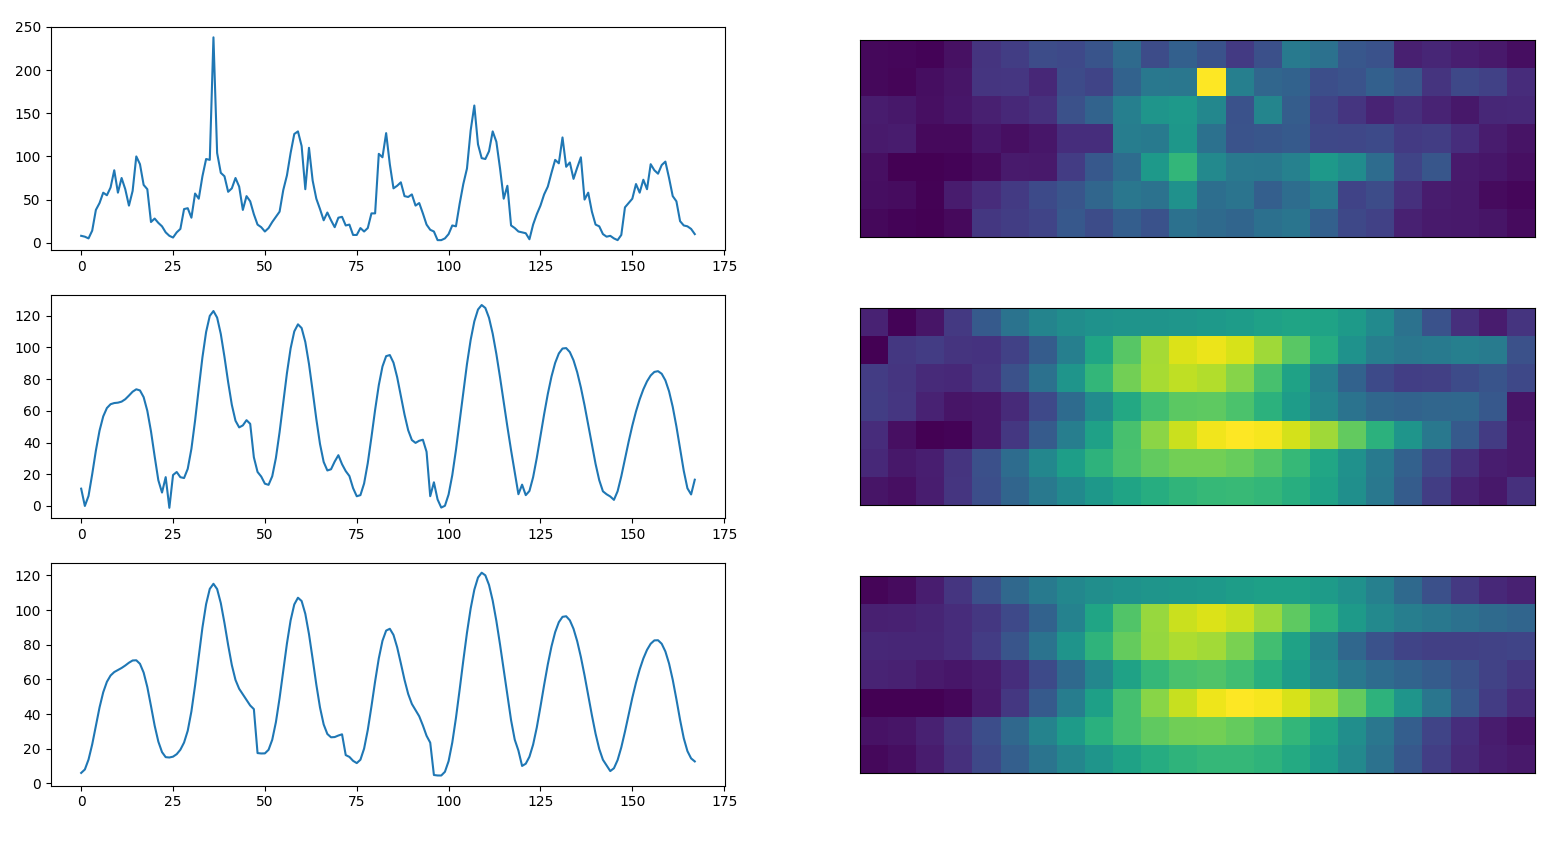 time series in pictures
Which is important to induce correlation between days and use more sofisticated methods
 reference prediction
We can interpolate data to have more precise information and induce correlation between neighbors
 interpolate
population density
If we want to know how dense is an area with a particular geo feature
 spot building distance
We can reduce the density of feature fitting the radial histogram and returning the convexity of the parabola
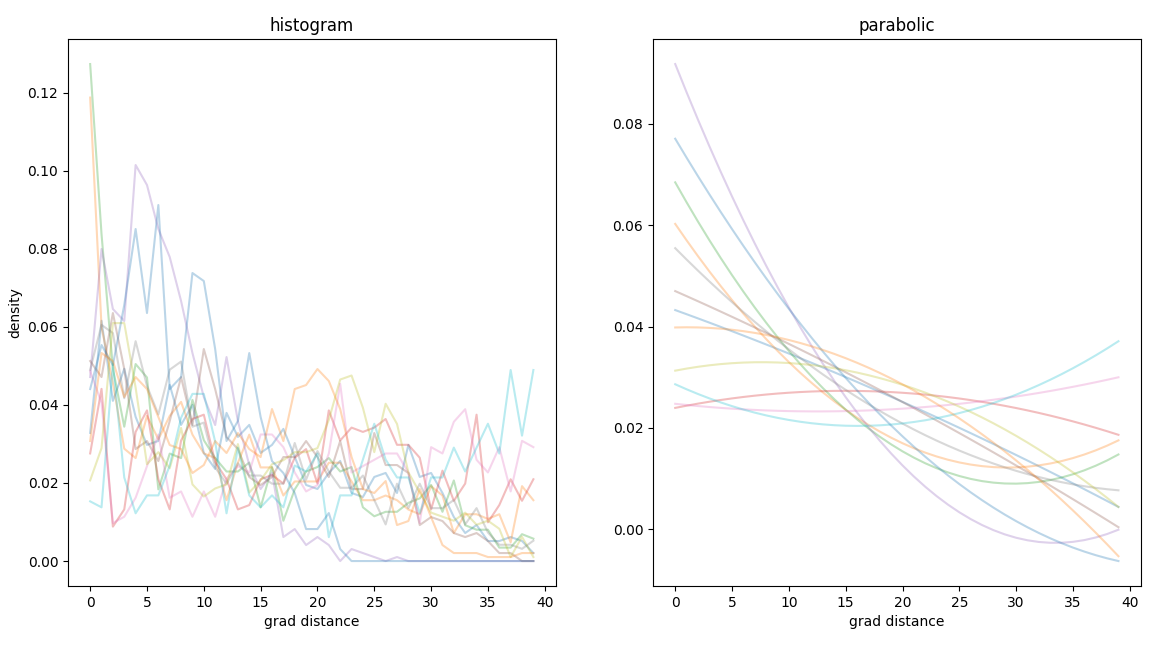 spatial degeneracy,
parabola convexity
If we apply boosting the distribution will change and therefore we can train another model to predict the residuals
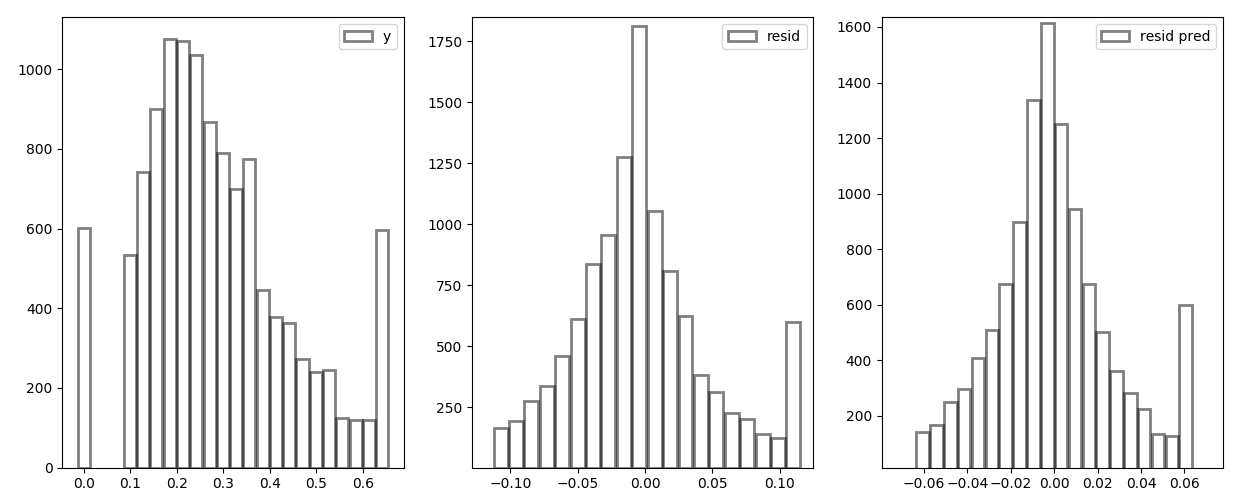 residual
distribution
Encoder options
Weekdays are categorical but they are intercorrelated, it is convinient to group workdays and weekend and stretch the time: {weekday:1,weekend:2} -> {weekday:1,weekend:0.5}
